


The following is the established format for referencing this article:
Plasencia-León, C., N. Viña-Dávila, R. Delgado-Téllez, F. L. Tamayo-Escobedo, and A. Alcolea-Portal. 2026. Spatiotemporal distribution of the Cuban Gnatcatcher (Polioptila lembeyei) in the Siboney-Juticí Ecological Reserve, Cuba. Journal of Field Ornithology 97(2):13.ABSTRACT
The Cuban Gnatcatcher (Polioptila lembeyei) is an endemic bird with a discontinuous distribution in Cuban coastal scrublands and its effective conservation requires a fine-scale understanding of its distribution. Although lacking an IUCN threat category, it faces critical pressures from habitat fragmentation and climate change. This study characterizes its spatiotemporal distribution and habitat associations in the eastern sector of the Siboney-Juticí Ecological Reserve using data from 2012–2014 and 2016. Through variable-radius point counts and playback surveys, geostatistical analyses revealed a significantly clustered distribution pattern. Core areas of secure presence and high detection density were concentrated in the south of the study area, while absence zones predominated in the north. The species showed strong restriction to coastal and precoastal xeromorphic scrub but exhibited heterogeneous distribution within this habitat. Temporal analysis demonstrated interannual stability in core distribution areas and no significant detection rate differences between breeding and non-breeding seasons. Verification surveys confirmed persistent absence zones not attributable to detectability issues. Vegetation analysis showed that presence areas had significantly lower canopy cover and tree density, confirmed by a negative binomial GLM identifying tree abundance as a significant negative predictor. Complementary analysis revealed significantly lower normalized difference vegetation index (NDVI) values in presence areas, reinforcing the species’ preference for open, low-stature vegetation. These findings demonstrate high microhabitat specificity within the scrub matrix. This provides crucial insights for refining national distribution models through appropriate variable selection, particularly vegetation structure and NDVI. Furthermore, these insights guide targeted conservation strategies for this endemic species by identifying and protecting essential habitat patches that support its core populations.
RESUMEN
La Perlita Cubana o Sinsontillo (Polioptila lembeyei) es un ave endémica con una distribución discontinua en matorrales costales y su conservación efectiva requiere un entendimiento detallado de su distribución. Aunque carece de una categoría de UICN, la especie enfrenta presiones críticas por fragmentación de hábitat y cambio climático. Este estudio caracteriza su distribución espaciotemporal y sus asociaciones de hábitat en el sector oriental de la Reserva Ecológica Siboney-Juticí, usando datos de 2012-2014 y 2016. A través de puntos de conteo de radio variable y censos con playback, análisis geoestadísticos revelaron una distribución agregada significativa. Áreas clave de presencia segura y de alta densidad de detección se concentraron en el sur del área de estudio, mientras que zonas de ausencia predominaron en el norte. La especie mostró fuerte restricción a matorral xeromórfico costero y pre-costero, pero exhibieron una distribución heterogénea dentro de este hábitat. Análisis temporales demostraron una estabilidad interanual en áreas clave de distribución y diferencias no significativas en las tasas de detección entre estaciones reproductivas y no reproductivas. Censos de verificación confirmaron la persistencia de zonas de ausencia no atribuible a motivos de detectabilidad. El análisis de vegetación mostró que las áreas de presencia tuvieron significativamente menor cobertura de dosel y menor densidad de árboles, confirmado por un GLM negativo binomial que identificó a la abundancia de árboles como un predictor negativo significativo. Un análisis complementario reveló menores valores de índice de diferencia normalizada de vegetación (NDVI) en áreas de presencia, reforzando la preferencia de la especie por vegetación abierta y de baja estatura. Estos hallazgos demuestran una especificidad alta al microhábitat dentro de la matriz de matorral. Esto proporciona información crucial para perfeccionar los modelos de distribución nacional mediante la selección adecuada de variables, particularmente la estructura de la vegetación y NDVI. Además, esta información crucial guía estrategias de conservación específicas para esta especie endémica mediante la identificación y protección de parches de hábitat esencial que sustentan a sus poblaciones principales.
INTRODUCTION
The Cuban Gnatcatcher (Polioptila lembeyei) is an endemic bird species of Cuba. It belongs to the most species-rich genus in the family Polioptilidae, which comprises 18 species in total (Winkler et al. 2020). Species within this genus occupy a broad range of habitats, from open woodlands and desert scrub to tropical rainforests. However, only seven species have adapted to more than one habitat type. The other 11 are restricted to specific ecosystems, which considerably limits their distributions (Winkler et al. 2020). Cuban Gnatcatcher is among five species confined to arid and semi-arid scrublands and dry forests (Atwood et al. 2020, Winkler et al. 2020).
This species is strongly associated with dense, thorny coastal vegetation dominated by cacti and shrubs of semi-arid scrublands, from central to eastern Cuba (Gundlach 1876, Garrido and Kirkconnell 2011, Chesser et al. 2021). Specifically, in southeastern Cuba, it inhabits natural and secondary dry forests and scrublands with xerophytic characteristics, regardless of altitude or immediate proximity to the coast (Plasencia-León et al. 2020). Its distribution has been linked to the Cuban cactus scrub ecoregion (Atwood et al. 2020), although this definition fails to explain the species’ absence in western Cuba or its presence on the keys north of Camagüey and Ciego de Ávila, areas located outside the boundaries of that ecoregion.
The species is currently classified as Least Concern on the IUCN Red List (Atwood et al. 2020, BirdLife International 2024), but this classification has not considered all the aspects that could endanger the populations. In Cuba, its distribution coincides with areas of intense tourism and industrial, energy, and agriculture development, which could lead to critical fragmentation that threatens small and isolated populations, limiting their connectivity and genetic viability (Plasencia-León et al. 2020). In addition to these anthropogenic threats are the effects of climate change, with projections indicating a drastic reduction in its climatically suitable area and an increase in the intensity of meteorological disturbances (Mancina et al. 2022). Together, these factors underscore the urgent need to implement management strategies that extend beyond the scope of protected areas.
The published distribution of the Cuban Gnatcatcher has a coarse spatial resolution, which hinders the accurate delineation of priority areas, the spatially explicit assessment of threats, and the implementation of evidence-based conservation actions at the local level. One solution is to develop a robust species distribution model (SDM) to generate high-resolution predictions of habitat suitability. However, for the Cuban Gnatcatcher, developing a reliable SDM first requires a comprehensive understanding of habitat drivers at the local scale, particularly vegetation cover attributes that determine or influence the species’ presence. Consequently, this study aims to (1) determine the spatio-temporal distribution patterns of the species at the local scale and their relationship with habitats, and (2) identify which specific vegetation cover characteristics are associated with its presence.
To investigate the distribution and evaluate the species’ response to vegetation cover, we selected the Siboney-Juticí Ecological Reserve as a study site. It sustains a highly abundant population within a conserved area (Fong et al. 2005) and contains xerophytic habitats consistent with its reported preferences (Plasencia-León et al. 2020). Furthermore, previous research conducted in this reserve has generated foundational knowledge, including studies of the reproductive behavior of the Cuban Gnatcatcher (Sanchez-Losada et al. 2015) and evaluations of playback survey techniques (Plasencia-León et al. 2019), establishing it as an ideal location for this detailed investigation.
MATERIALS AND METHODS
Study area
The Siboney-Juticí Ecological Reserve (RES-J) is located in the Eastern Region of Cuba, in the province of Santiago de Cuba. Its approximate center is at 19.957° N, -75.766° W. The reserve covers a total area of 3340 ha, of which the terrestrial portion accounts for 35.4% (1180 ha; Corredor Biológico en el Caribe BioAtlas 2021), while the remaining 65% is a protected marine area.
The terrestrial area of the reserve lies within the Cuban cactus scrub ecoregion (Olson et al. 2001). Nine distinct habitat types are recognized within its boundaries: five forest formations, two scrublands, and two grasslands (Fong et al. 2005). The most extensive habitats are the coastal and pre-coastal xeromorphic scrub and the microphyllous semideciduous forest (Reyes 2012). These two habitats are also of paramount importance for conservation, as they harbor the majority of the endemic species found in the area (Fong et al. 2005).
The topography of the terrestrial area primarily comprises slopes (25.7%) and ridges (25.5%). Elevation ranges from 0 m above sea level (masl) to an approximate maximum of 139 masl, with a mean of 60 masl. The climate of the study area is predominantly arid and desert-like. It is under the influence of drying winds that descend from the mountains and is characterized by a mean annual minimum temperature of 21.8 °C and mean maximum temperatures of 30.3 °C. The mean annual cumulative precipitation is 1142.8 mm (Corredor Biológico en el Caribe BioAtlas 2021).
The study was conducted in the eastern sector of the RES-J, (19.962° N, -75.714° W). This sector covers an area of 78 ha, measuring 1.6 km in length and 0.7 km in width. The topography consists primarily of slopes (41.5%), and elevation ranges from 26 masl to 107.0 masl (Corredor Biológico en el Caribe BioAtlas 2021). It contains the three most extensive habitats within the Siboney-Juticí Ecological Reserve (Appendix 1; Fong et al. 2005).
The vegetation in the eastern sector of the Siboney-Juticí Ecological Reserve is diverse and depends on the area’s climatic and geological factors. It exhibits marked xerophytic characteristics, the most evident adaptations being the presence of spines, microphylly, and succulents (Fong et al. 2005). The area contains two types of forest and one scrubland.
The microphyllous semideciduous forest occupies 29.7 ha and features a tree stratum 8 to 14 m in height with variable canopy cover. It is primarily represented by Bursera simaruba, has a dense shrub stratum, and lacks a herbaceous stratum. The secondary shrubland on a microphyllous semideciduous forest ecotope has a very dense shrub stratum, 5 to 7 m in height, contains a sparse herbaceous stratum, and covers an area of 22.2 ha. The coastal and precoastal xeromorphic scrub is the most extensive habitat in the eastern sector, covering 46.8 ha, and is abundant in Adelia ricinella. The shrub stratum is denser, reaching 1 to 1.5 m in height, and features abundant cacti (Fong et al. 2005).
Field methods
To address the study objectives, five methods were employed. Three were used to analyze the spatial and temporal distribution of P. lembeyei, and two enabled the characterization of vegetation cover and its relationship with this distribution. A summary is provided in Table 1.
Cuban Gnatcatcher spatial distribution
The spatial distribution of P. lembeyei was characterized using the variable-radius point count method (Wunderle 1994). From each georeferenced point, the observer detected individuals and estimated the distance to each bird and the bearing to the plot center. A single, highly experienced observer conducted all counts, facilitating the spatial mapping of every detection. A detection was defined as the visual or acoustic identification of a bird.
Each point was surveyed for five minutes, although 10 minutes is suggested for Caribbean birds (Wunderle 1994). However, P. lembeyei has high detectability, and reducing the survey time helped minimize the potential for double-counting. It is important to note that the double-counting of individuals does not affect our core results, as the detection of individuals primarily serves to reinforce evidence of area use.
Surveys were performed at least monthly between 06:00 and 10:00 hours on days with sunny conditions and low wind, adhering to Wunderle’s (1994) protocol. A different starting point was used on each sampling day to prevent time of day effects on detection probability.
A total of 49 count points were established in 2012. Subsequent data analysis revealed zones of species absence, likely due to point distribution, topography, or land cover. To mitigate this, five points were added over the next two years (two in 2013, three in 2014), resulting in a final total of 54 points.
The 54 count points were established within the eastern sector of the RES-J, utilizing existing roads and trails (Fig. 1) to ensure coverage of all three vegetation formations present. The spatial dispersion of these points was confirmed (NNI = 1.55, P < 0.01, z = 7.06), guaranteeing homogeneous coverage of the study area. Points were separated by a walking distance of 100–144 m (± 4 m accuracy) from the subsequent point, with an average absolute (Euclidean) distance of 105 m ± 17 m (range: 75–144 m) between any given points.
Sampling was conducted between 2012 and 2014. The initial year (2012) was exploratory, with fieldwork from April to August to assess the appropriateness of the methods during the species’ breeding season (Sanchez-Losada et al. 2015), when its behavior varies from high vocalization to becoming more inconspicuous (Atwood and Lerman 2006). This confirmed the suitability of the variable-radius point count method for characterizing the species’ distribution under RES-J conditions. Data from 2012 were used exclusively for spatial distribution analyses. In 2013 and 2014, sampling was conducted monthly; however, the two sampling events per month between January and June occurred only in 2013.
Cuban Gnatcatcher temporal distribution
Temporal distribution was based on detections obtained in 2013 and 2014. To homogenize the sampling effort across both years, the count with the lowest number of detections in months with double counts was discarded. For each year, the distribution was analyzed during the breeding and non-breeding seasons.
The breeding season was defined by integrating three data sources: published reproductive phenology spanning from March to July (Sanchez-Losada et al. 2015), observations of brood patches and cloacal protuberances in mist-netted individuals (Estación de Anillamiento Juan Cristóbal Gundlach 2025, unpublished manuscript), and year-round behavioral monitoring documenting post-fledging parental care. Capture data were obtained from the permanent Juan Cristóbal Gundlach banding station and processed as part of this study. These data derive from monthly monitoring conducted using 22 mist nets covering 2.3 ha of coastal xeromorphic scrubland within the study area. A total of 104 captures of P. lembeyei were recorded between July 2010 and 2016 over 16,004.4 net-hours.
Verification of Cuban Gnatcatcher absence zones
Preliminary analyses of the results identified zones of absence of the species within the study area. To verify that the absence zones were not caused by detectability biases, the sampling method was supplemented with the use of playback, which has a high efficiency for detecting the species (Plasencia-León et al. 2019).
The study was conducted from January to April 2016. This period was selected because of increased daily activity from pre-reproductive behaviors such as territory defense and mate searching which heightens detectability in species of the genus Polioptila (Atwood and Lerman 2006). We sampled the same point count locations established for spatial distribution studies between 2012 and 2014, conducting surveys on a weekly basis.
At each point, variable-radius point counts were conducted for five minutes (Wunderle 1994). After this period, a variable-radius point count method accompanied by playback was applied (Plasencia-León et al. 2019). If there was a response, the presence of the individual, the detection distance, and the bearing were recorded; in this case, the second playback was not performed. If there was no response, a second playback was conducted after two minutes, and the result was noted (Plasencia-León et al. 2019).
The playback duration was one minute. During playback execution, the sound source was rotated to face each of the four cardinal directions, lasting approximately 15 seconds in each direction (Plasencia-León et al. 2019).
Playback was broadcast using a sound player at a constant volume, audible at 50 m based on previous measurements and always set to the same level. According to the literature (Atwood and Lerman 2006), the optimal playback volume should be approximately the same as the volume of the bird’s song heard at the maximum distance where it is still audible to the observer. A recording from the Siboney locality was used to avoid altered responses from individuals due to potential dialect variations (Johnson et al. 1981).
Vegetation cover characterization
The characteristics of the vegetation in the sampled habitats and their relationship with the presence of P. lembeyei were obtained from a characterization of the study area’s vegetation cover using the circular plot method adapted for ornithological research (James and Shugart 1970, Noom 1980). We used 48 vegetation plots established in 2012, which were distributed randomly (NNI = 1.05; z = 0.69, P = 0.49) to encompass the present habitats.
Vegetation cover variables were measured in circular plots with a radius of 11.3 m (0.04 ha), ensuring vegetation conditions remained homogeneous within an approximate 50 m radius. Each plot was divided into four quadrants according to the cardinal points (NE, SE, SW, NW). The percentage of canopy cover, ground cover, and vertical cover at four different heights (0–30 cm, 30–100 cm, 100–200 cm, and 200–300 cm) was estimated. The number of trees and the number of stems smaller than 3 cm in DBH (diameter at breast height) were quantified per quadrant to estimate understory density. A plant was considered a tree if it had a defined woody trunk, a minimum height of 5 m, and a minimum DBH of 5 cm (FAO 2004).
In October 2012, the area was affected by Hurricane Sandy. This event did not cause severe damage to the vegetation structure. Ecological adaptations to extreme conditions allowed for a rapid recovery of the vegetation cover with subsequent rainfall in the following months. This allowed us to use the vegetation cover data obtained previously and incorporate it into the distribution analysis of P. lembeyei for the years 2012 to 2014.
To complement the vegetation characterization and its relationship with the species’ presence, a spectral analysis of the vegetation cover was performed using the Normalized Difference Vegetation Index (NDVI; Kriegler et al. 1969, GISGeography 2017). We used 819 images from 12 periods: six dry and six rainy periods between 2009 and 2015. The images were obtained from the Landsat Collection 2 (Wulder et al. 2019, Masek et al. 2020). The resulting spectral image of the study area contained 1100 pixels, with the median of the pixel values obtained over the selected time period.
Analytical methods
For characterizing of spatial distribution, detections obtained from 2012 to 2014 were used, including the sampling events conducted twice per month in 2013. The count points and detections of P. lembeyei were converted into Geographic Information System (GIS) layers. An analysis area was delineated based on the Minimum Convex Polygon (MCP) resulting from the perimeter line connecting the outermost detections. A 50 meter wide buffer was then added to this polygon, resulting in a total analysis area of 109 ha.
The geostatistical Average Nearest Neighbor (ANN) tool was employed to determine the distribution pattern of the recorded observations. Detection density maps were generated using Kernel Density estimation. A cell size of three meters and a search radius of 100 m were utilized, as derived from the bandwidth smoothed by Scott’s rule. Four detection density areas were generated and divided into quantiles, which were then classified as areas of secure presence (very high detection density), areas of high detection density, areas of low detection density, and areas of absence or very low detection density.
For the temporal analysis, the distribution pattern was determined and a map was generated, using a methodology similar to the spatial analysis. The detection data used for each year and for the breeding and non-breeding seasons were converted into GIS layers. The area of similarity between the spatial distributions for 2013 and 2014 was determined by intersecting both layers and analyzing the common area.
To compare detections between the breeding and non-breeding seasons within each year, the Wilcoxon signed-rank test was used for each point-count station. These analyses included 51 point-count stations in 2013 and 54 stations in 2014.
For absence area verification, the detections obtained at each point count by both methods were used. The detections of P. lembeyei were converted into Geographic Information System (GIS) layers. To identify the detection density areas generated by each method, the Kernel Density tool was used with the same parameters as in the spatial distribution analyses.
Vegetation cover was characterized according to detection density areas for P. lembeyei, generated from the spatial distribution analyses. Descriptive statistics were applied to each variable, and comparisons between areas were performed using the non-parametric Kruskal-Wallis test.
A Negative Binomial Generalized Linear Model (NB-GLM) with a log-link function was used to analyze the relationship between vegetation variables and individual counts. This approach was selected because of significant overdispersion in the count data. Predictor variables were initially screened using Spearman’s rank correlation, and the final multivariable model was selected through a stepwise process based on the corrected Akaike Information Criterion (AICc). The final model was assessed for multicollinearity using Variance Inflation Factors (VIF), confirming independence between predictors (VIF = 1.00). Results are reported as Incidence Rate Ratios (IRR) with 95% confidence intervals.
For these analyses, the location and characteristics of each plot were converted into GIS layers. To associate species presence with vegetation plots, detection data layers from the 2012–2014 period were utilized. A circular buffer with a 50 m radius was created around the center of each vegetation plot and intersected with the species detection layer. This process identified vegetation plots where P. lembeyei was detected within 50 meters of the plot center.
To characterize NDVI values across the different detection density areas of P. lembeyei, descriptive statistics (median, maximum, and minimum) were calculated. The comparison of NDVI values among areas with distinct detection densities was performed using the non-parametric Kruskal-Wallis test.
RESULTS
Cuban Gnatcatcher spatial distribution
From 2012 to 2014, 999 detections of the Cuban Gnatcatcher were obtained across 54 counting points during 28 months of work. Of these, 53% of the detections were concentrated in just 12 counting points, each with more than 30 sightings. The species was never observed at seven counting points (Fig. 2).
The detections of the Cuban Gnatcatcher exhibited a significantly clustered distribution pattern (NNI = 0.61; Z = -19.97; P < 0.001). Figure 3 shows the spatial distribution of areas with varying detection density during this period, where the clustering of areas with high observed occurrence is evident. Zones of secure presence and high detection density were discontinuous, distributed primarily in the south, and covered a total of 55.1 ha. In contrast, areas of absence or very low detection density were more prevalent in the north, encompassing 26.6 ha of the study area.
The secure presence areas of P. lembeyei represented 45.5% (21.3 ha) of the total extent of the coastal and precoastal xeromorphic scrubland (46.8 ha). In contrast, only 3.2% (1.5 ha) of this habitat was classified as an area of absence.
Within the secondary forest of the microphyllous semideciduous forest biotope, areas of secure presence covered 9.5% (2.1 ha) of this habitat in the study area (22.2 ha), while areas of absence accounted for 50.5% (11.2 ha). This formation has a separate nine-hectare area in the northwest, which was entirely classified as having absence or very low detection density, and was also surveyed. In this zone, the species was detected on only four occasions, all between February and March of 2013, five months after Hurricane Sandy.
The areas where P. lembeyei was present in the microphyllous semideciduous forest covered 7.1% (2.1 ha) of the total habitat area (29.7 ha). The area where it was absent covers 35.7% (10.6 ha) of its surface.
Cuban Gnatcatcher temporal distribution
In 2013, a total of 261 detections of the Cuban Gnatcatcher were recorded in the study area. Detections occurred in 74% of the sampling points, while 12 points showed no presence of the species. Seven counting points concentrated the 40.2% of the year’s total detections. Monthly detection rates also showed variation (Fig. 4). Following a period of high detection from January to March (peaking in February), sightings declined gradually, with the lowest number recorded in October.
In 2014, the species was detected 303 times across the original 51 counting points. Following the addition of three new points, the annual detection total increased to 338. Detections occurred at 77% of the counting points, and similar to 2013, the species was not detected at 12 points, with 75% (9 points) overlap between years. The 13 points with the highest detections concentrated 58.2% of the annual detections. Monthly detection totals also fluctuated (Fig. 4). Unlike the previous year, the peak occurred in April, followed by May. After a decline in June, detections remained above 30 through August, dipped slightly in September, rebounded in October, and fell again in November and December.
Detections in 2013 (n = 261) and 2014 (n = 338) each exhibited a distribution pattern similar to the general pattern (clustered). This pattern was also consistent across both reproductive and non-reproductive seasons within these years (Table 2). The analysis for 2013 and 2014 (Fig. 5) confirms this clustered distribution of detections. In both years, the secure presence and the high detection density areas were located in the southern part of the study area, whereas areas of absence predominated in the north.
The areas of high detection density for the species covered 54.8 ha in 2013 and 54.6 ha in 2014. The spatial overlap between these two years was 43.4 ha, representing 79.1% of the area from 2013 and 79.5% of the area from 2014. These results indicate strong interannual stability in the spatial distribution of areas with secure presence and high probability of detection for P. lembeyei.
The reproductive season for this population was redefined as extending from March to August, based on the integration of breeding physiology records and year-round behavioral observations, including post-fledging parental care. Accordingly, all remaining months were classified as the non-reproductive season.
The number of detections obtained through point count surveys did not differ significantly between the reproductive (n = 131) and non-reproductive (n = 130) seasons in 2013 (W = 0.48, P = 0.62, n = 51). Throughout both seasons, the secure presence and high detection density areas were primarily located in the southern portion of the study area (Fig. 5). The greatest variation in the extent of detection density areas between seasons was observed in the absence areas, which decreased by 2.6 ha during the reproductive season, and in the low detection density areas, which increased by 2.1 ha. The presence and high detection density areas showed a smaller difference of 1.5 ha in extent between seasons.
During the breeding season, the area of secure presence shifted to the southwest of the study area. In the non-breeding season, this area fragmented into two smaller cores of secure presence. The areas of absence and low detection density exceeded 52% of the analysis area in both seasons.
Detections during the 2014 breeding and non-breeding seasons did not differ significantly (W = 2.87, P = 0.06, n = 54 pairs), with 195 and 141 detections recorded, respectively. In both seasons, areas of secure presence and high detection density were distributed predominantly in the southern portion of the study area, with a slight northeastward trend (Fig. 5). The extent of the secure presence area was 2.6 ha larger during the breeding season than in the non-breeding season, whereas the absence area decreased by 2.1 ha. The high and low detection density areas showed smaller variations of ≤ 0.7 ha between seasons.
Verification of Cuban Gnatcatcher absence zones
A study was conducted in 2016 to verify that zones of absence were not caused by detectability issues. Using the point-count method without playback, 390 detections were obtained, whereas 573 detections were obtained with playback.
Without playback, the species was never detected at 10 point-count locations. This number was reduced to five locations when playback was used. These five points, which were consistent absence points across both methods, included two locations where the species was also never observed between 2012 and 2014. All points with no detections were located in secondary shrub forest dominated by Leucaena leucocephala or in semideciduous microphyllous forest.
The five points that recorded detections with the playback survey method, but not with the method without playback, were located in secondary shrub forest dominated by Leucaena leucocephala or in semideciduous microphyllous forest. However, the counts were low detections at these five points occurred in only one of the 12 sampling sessions. In three of them, one individual was detected and in the remaining two, two individuals were observed.
Vegetation cover analysis
The results revealed differences in canopy cover (H = 11.2; P = 0.01, n = 48) and number of trees (H = 13.4; P = 0.004, n = 48) among the four P. lembeyei detection density areas (Table 3). The areas of definite presence and high detection density were characterized by a canopy cover of less than 70%, which contrasted significantly with the denser coverage found in the areas of absence or very low detection density (median of 93%; Table 3).
The presence of the species is reinforced by the results on the number of trees. The medians showed an increasing gradient, from the areas of definite presence (16 trees) and high detection density (21 trees), to the areas of low detection density (36 trees), and finally the areas of absence, which had the highest tree density (55 trees; Table 3). The vertical structure and the understory remained homogeneous and dense across all presence categories (Table 3).
The negative binomial model confirmed that Cuban Gnatcatcher detections were significantly associated with two vegetation variables after accounting for multicollinearity. Tree abundance exhibited a robust negative effect (IRR ≈ 0.962; 95% CI: 0.945–0.979; P < 0.001), corresponding to an approximate 3.8% reduction in expected detections per additional tree when other covariates were held constant. Vertical stem density in the 100–200 cm layer also showed a negative association (IRR ≈ 0.960; 95% CI: 0.919–1.003), although this result was only marginally significant (P = 0.071). To maintain model stability, strongly correlated predictors such as canopy cover (ρ ≈ 0.62 with tree number) were excluded, ensuring that retained variables provided non-redundant information on vegetation structure.
To complement the results obtained from the NB-GLM, we conducted a subsequent analysis using the Normalized Difference Vegetation Index (NDVI) variation. Among the detection density areas evaluated, the area of secure presence showed the lowest NDVI values (Median = 0.35; Max = 0.44; Min = 0.17; n = 300; Fig. 6). The distribution of NDVI values across the four areas of potential Cuban Gnatcatcher presence differed significantly (H = 443.98, df = 3, P < 0.001; Fig. 6).
DISCUSSION
The methodological adjustments implemented to characterize the spatiotemporal distribution of Polioptila lembeyei allowed the robust representativeness achieved by the final 54-point design. This significantly strengthened confidence in the described distribution patterns. The adaptive addition of five sampling points during the study substantially enhanced spatial coverage in topographically complex areas with distinct land cover types, thereby reducing potential sampling bias. This design was essential for detecting fine-scale associations of the bird within the study area.
The spatial concentration of P. lembeyei within xeromorphic scrub is enabled by its morphological characteristics (Atwood and Lerman 2006). These traits promote specialization in this habitat type and allow the species to efficiently exploit an environment with a dense, branched structure. Use of this habitat is not circumstantial but rather constitutes the space where the species performs all of its vital activities (Atwood and Lerman 2006).
Previous habitat descriptions for P. lembeyei (Gundlach 1876, Garrido and Kirkconnell 2011, Atwood et al. 2020) have characterized its association with coastal and precoastal xeromorphic scrub, which is confirmed in the studied area, but our data reveal that occupancy within this habitat is not homogeneous. Patches of scrub in our study area were classified as zones of absence or very low detection density, a pattern also reported for P. californica, which does not occupy all available tracts of coastal scrub for breeding (Atwood and Bontrager 2020). These results imply that assuming the presence of the species based solely on the distribution of coastal xeromorphic shrubland, at least in southeastern Cuba (Plasencia-León et al. 2020), may overestimate its actual area of occupancy.
Coastal and precoastal xeromorphic scrub in the area exhibits an irregular structure (Fong et al. 2005). Most of this plant formation occurs on limestone outcrops with minimal soil, where primary nutrients are derived from leaf litter. In front of the terraces, the vegetation is wind pressed against the rock, reaching about one meter in height; this is an area where P. lembeyei is commonly observed. In contrast, patches where the species was absent featured greater sediment accumulation, allowing vegetation to reach heights of five to eight meters (Fong et al. 2005).
A similar behavioral preference is described for Polioptila californica, which favors scrub patches with a maximum height of two meters and relatively well-spaced vegetation (Braden et al. 1997, Atwood et al. 1998). This species is less likely to occupy areas of very dense scrub compared to more open areas (Atwood and Bontrager 2020).
Early successional habitats can support P. lembeyei, but all evidence indicates that this occurs only when they replicate the open scrub structure characteristic of coastal and pre-coastal xeromorphic scrub. This pattern aligns partially with the ecology of other Polioptila species, several of which are known to use secondary or disturbed habitats (Atwood and Lerman 2006), although many remain habitat specialists. The absence of the species in other portions of the same secondary forest biotope underscores that its use of such environments is conditional and depends on specific structural attributes rather than habitat age or origin.
Microphyllous semideciduous forest is largely unsuitable for P. lembeyei because of its closed canopy. Its presence is restricted to the ecotone with the Coastal and precoastal xeromorphic scrub, where the structural conditions appear to create a favorable microhabitat, highlighting the importance of these ecological boundaries for the species.
These data are key for the management of coastal xeromorphic shrubland areas with secondary vegetation where P. lembeyei still occurs. In these areas, it is essential to prevent the growth of invasive exotic tree species (Leucaena leucocephala), which can generate unfavorable structural changes for the species, reduce its distribution area, and affect connectivity among presence patches.
Detections in the Microphyllous semideciduous forest and in the secondary scrub within the microphyllous semideciduous forest biotope were restricted to areas transformed by human activity, ecotones, or locations where geological conditions limit substrate depth, thereby restricting canopy development (Fong et al. 2005). This pattern suggests that transformed areas of anthropogenic or edaphic origin that maintain an open scrub structure may serve as refugia or corridors for the species, although they do not replace primary habitat.
The 2013 detection of the species in areas previously classified as absence zones (2012–2014) is likely attributable to habitat displacement caused by Hurricane Sandy’s passage through the study area in October 2012, which damaged its core coastal breeding habitat (Sanchez-Losada et al. 2015) and forced individuals inland into suboptimal areas within the reserve. Such extreme phenomena often cause severe habitat loss or degradation, prompting birds to expand into adjacent areas and even appear in atypical vegetation formations (Wiley and Wunderle 1993, Wunderle 2005). Therefore, these records likely do not reflect a stable habitat preference but rather an immediate behavioral response to landscape alteration.
The vulnerability of the species’ habitats becomes even more critical under climate change. These areas are naturally located near the coastal zone and, in some sites, occur in very narrow strips. Climate models project significant warming of air and sea surface temperatures in the Caribbean basin by the end of the century under high-emission scenarios (Bustos Usta and Torres Parra 2025). These trends are expected to extend the hurricane season, increase the frequency of intense storms (Masters 2025), and lead to higher wind speeds and extreme rainfall rates, with a greater proportion of Category 4 and 5 hurricanes as global temperatures rise (Sparks and Toumi 2025).
For P. lembeyei, whose optimal habitat is concentrated in specific coastal scrub patches, more intense hurricanes increase the risk of direct territory loss and reduce recovery time for the open vegetation structure it requires. Shorter intervals between major storms, combined with more frequent compound disasters, could exacerbate invasive tree colonization in post-disturbance areas and further degrade habitat quality for this endemic species.
The apparent eastward expansion of the species’ distribution in 2014, establishing a new core area in the southern and eastern survey zone, likely reflects an improvement in sampling coverage rather than a true biological range shift. This pattern can be attributed to the strategic addition of survey points that year, which filled a prior sampling gap in that region. Consequently, these new records more accurately represent the species’ existing but previously undetected presence, underscoring the critical influence of survey design on interpreting distributional changes over time.
The lack of significant seasonal differences in detection rates is consistent with year-round territoriality in P. lembeyei, a behavior also reported for North American congeners (Winkler et al. 2020). However, seasonal dynamics were observed: the expansion of low-detection-density areas and contraction of secure presence zones during the non-breeding season suggest two concurrent processes: reduced vocal activity (Atwood and Lerman 2006) and juvenile dispersal, a behavior documented in related species such as P. californica (Atwood and Bontrager 2020).
The consistency between methods with and without playback demonstrates that absence zones represent genuine distributional limits rather than detectability bias. The points with absence were very similar between both methods, because the isolated individuals detected only with playback in a single sampling session could simply be individuals attracted by the playback itself, rather than evidence of a stable population in those areas.
Closed canopy conditions and high tree abundance appear to reduce habitat quality for P. lembeyei. This greater structural complexity may limit habitat availability for the species, while areas with fewer trees likely offer more open microenvironments that facilitate foraging and movement.
NDVI effectively discriminates between occupied and unoccupied areas, offering a remote-sensing tool for landscape-scale habitat assessment. The lower NDVI values in presence zones reflect the open, low-biomass vegetation structure that defines suitable habitat. An NDVI threshold (< 0.44) could guide identification of potential habitat patches for field validation across the species’ Cuban range, though ground-truthing across multiple sites is needed to assess regional variation.
CONCLUSIONS
The results demonstrate that Polioptila lembeyei exhibits a clustered spatiotemporal distribution pattern at a local scale. The species shows high habitat specificity, being almost entirely restricted to the coastal and precoastal xeromorphic scrub in the study area, within which its distribution is not homogeneous but rather concentrated in well defined core areas. The identification of secure presence zones and absence zones in spatially proximate areas underscores the species’ selectivity for particular micro-environmental conditions. Factors such as low tree density and low NDVI values characterized the presence areas, indicating a preference for low stature and open vegetation.
The verification of absence areas in 2016 confirmed the reliability of the distribution patterns identified between 2012 and 2014. Although extreme events such as Hurricane Sandy can cause temporary displacements into not optimal habitats, the core distribution of the population remained stable across years. These findings provide an important foundation for variable selection in habitat suitability models and are crucial for guiding conservation efforts. They emphasize the need to protect the specific patches of coastal and precoastal xeromorphic scrub that support the core populations of this endemic species.
RESPONSES TO THIS ARTICLE
Responses to this article are invited. If accepted for publication, your response will be hyperlinked to the article. To submit a response, follow this link. To read responses already accepted, follow this link.
ACKNOWLEDGMENTS
We thank the Centro oriental de Ecosistemas y biodiversidad, the Universidad de la Habana for their support with data for this work, the Universidad de Oriente; the Instituto de Ecologia y Sistematica and IDEAWILD for their support with equipment to conduct the research; to the Cornell Lab of Ornithology for providing us with the recording of the species’ song and for their support with essential materials for the research.
DATA AVAILABILITY
All data and GIS databases used in the manuscript are available upon request from the corresponding author.
LITERATURE CITED
Atwood, J., and S. B. Lerman. 2006. Gnatcatcher family Polioptilidae. Pages 350-377 in J. del Hoyo, A. Elliott, and D. A. Christie, editors. Handbook of the birds of the world. Lynx Edicions, Barcelona, Spain.
Atwood, J. L., and D. R. Bontrager. 2020. California Gnatcatcher (Polioptila californica), version 1.0 in A. F. Poole and F. B. Gill, editors. Birds of the world. Cornell Lab of Ornithology, Ithaca, New York, USA. https://doi.org/10.2173/bow.calgna.01
Atwood, J. L., S. B. Lerman, and G. M. Kirwan. 2020. Cuban Gnatcatcher (Polioptila lembeyei), version 1.0 in J. del Hoyo, A. Elliott, J. Sargatal, D. A. Christie, and E. de Juana, editors. Birds of the world. Cornell Lab of Ornithology, Ithaca, New York, USA. https://doi.org/10.2173/bow.cubgna1.01
Atwood, J. L., S. H. Tsa, C. A. Reynolds, and M. R. Fugagli. 1998. Distribution and population size of California Gnatcatchers on the Palos Verdes Peninsula, 1993-1997. Journal Western Birds 29:340-350.
BirdLife International. 2024. IUCN Red List of Threatened Species: Polioptila lembeyei. IUCN Red List of Threatened Species.
Braden, G. T., R. L. McKernan, and S. M. Powell. 1997. Association of within-territory vegetation characteristics and fitness components of California Gnatcatchers. Auk 114:601-609. https://doi.org/10.2307/4089279
Bustos Usta, D. F., and R. R. Torres Parra. 2025. CMIP6 Ocean and atmospheric climate change projections in the Seaflower Biosphere Reserve—Caribbean Sea—by the end of the twenty-first century. Pages 11-37 in J. E. Mancera Pineda, A. F. Osorio, C. Toro, and C. S. Velásquez-Calderón, editors. Climate change adaptation and mitigation in the Seaflower Biosphere Reserve. Springer Singapore. https://doi.org/10.1007/978-981-97-6663-5_2
Chesser, R., S. M Billerman, K. J. Burns, C. Cicero, J. L. Dunn, B. E. Hernández-Baños, A. W. Kratter, I. J. Lovette, N. A. Mason, P. C. Rasmussen, J. V. Remsen, Jr., D. F. Stotz, and K. Winker. 2021. Sixty-second supplement to the American Ornithological Society’s Check-list of North American Birds. Ornithology 138:ukab037. https://doi.org/10.1093/ornithology/ukab037
Corredor Biológico en el Caribe BioAtlas. 2021. Reporte automático sobre Reserva Ecológica Siboney-Juticí. Corredor Biológico en el Caribe BioAtlas. https://maps.cbcbio.org/
Fong, A., D. Maceira F., W.S. Alverson, and J. M. Shopland. 2005. Rapid biological inventories report 10. Siboney-Juticí, Cuba. The Field Museum, Chicago, Illinois, USA. https://doi.org/10.5962/bhl.title.86301
Food and Agriculture Organization (FAO). 2004. Global forest resource assessment update 2005. Terms and definitions. Forestry Department. FAO, Rome, Italy.
Garrido, O. H., and A. Kirkconnell. 2011. Field guide to the birds of Cuba. Cornell University Press, Ithaca, New York, USA.
GISGeography. 2017. What is NDVI (Normalized Difference Vegetation Index)? GIS Geography. https://gisgeography.com/ndvi-normalized-difference-vegetation-index/
Gundlach, J. C. 1876. Contribución á la ornitologia cubana. Pages 1-390. “La Antilla” de N. Cacho-Negrete, Habana, Cuba. https://doi.org/10.5962/bhl.title.68100
James, F., and H. Shugart. 1970. A quantitative method of habitat description. Audubon Field Notes 24:727-736.
Johnson, R., B. Brown, L. Haight and J. Simpson. 1981. Playback recordings as a special avian censusing technique. Studies in Avian Biology 6:68-75.
Kriegler, F., W. Malila, R. Nalepka, and W Richardson. 1969. Preprocessing transformations and their effect on multispectral recognition. Pages 97-131. Proceedings of the 6th International Symposium on Remote Sensing of Environment. Willow Run Laboratories, University of Michigan, Ann Arbor, Michigan, USA.
Mancina, C., C. Vega Catalá, S. del Castillo Domínguez, I. Fuentes Marrero, M. Bauzá Hernández, M. Hernández, H. Díaz Perdomo, M. Pernús Álvarez, A. Cajigas Gandia, R. Hernández-Prado, et al. 2022. El cambio climático y la biodiversidad en Cuba: impactos, adaptación y áreas prioritarias para la conservación. Editorial AMA, La Habana, Cuba.
Masek, J. G., M. A. Wulder, B. Markham, J. McCorkel, C. J. Crawford, J. Storey, and Del T. Jenstrom. 2020. Landsat 9: empowering open science and applications through continuity. Remote Sensing of Environment 248:111968. https://doi.org/10.1016/j.rse.2020.111968
Masters, J. 2025. The Caribbean has a super-hurricane problem. Yale Climate Connections, 12 November. https://yaleclimateconnections.org/2025/11/the-caribbean-has-a-super-hurricane-problem/
Noom, B. 1980. Techniques for sampling avian habitats. Pages in 42-53 in D. E. Capen, editor. The use of multivariate statistics in studies of wildlife habitat. U.S. Forest Service, Rocky Mountain Forest and Range Experiment Station, Fort Collins, Colorado, USA.
Olson, D. M., E. Dinerstein, E. D. Wikramanayake, N. D. Burgess, G. V. N. Powell, E. C. Underwood, J. A. D'amico, I. Itoua, H. E. Strand, J. C. Morrison, et al. 2001. Terrestrial ecoregions of the world: a new map of life on Earth. BioScience 51:933-938. https://doi.org/10.1641/0006-3568(2001)051[0933:TEOTWA]2.0.CO;2
Plasencia-León, C., N. Viña, and F. L. Tamayo. 2019. Evaluación del uso de reclamos para identificar la presencia de Polioptila lembeyei (Aves: Polioptilidae). Revista Cubana de Ciencias Biológicas 7.
Plasencia-León, C., N. Viña-Dávila, M. Padilla-Sánchez and E. E. Iñigo-Elias. 2020. Distribución de Sinsontillo (Polioptila lembeyei) en el sur del oriente de Cuba, implicaciones para su conservación. Novitates Caribaea 16:32-43. https://doi.org/10.33800/nc.vi16.225
Reyes, O. J. 2012. Clasificación de la vegetación de la Región Oriental de Cuba. Revista del Jardín Botánico Nacional 32/33:59-71.
Sanchez-Losada, M., A. Reyes Vázquez, F. Rodríguez Santana, N. Viña Dávila, and G. López Iborra. 2015. Biología reproductiva de Polioptila lembeyei (Aves: Polioptilidae) en la Reserva Ecológica Siboney-Juticí, Santiago de Cuba, Cuba. Journal of Caribbean Ornithology 28:6-10. https://doi.org/10.55431/jco.2015.28.6-10
Sparks, N., and R. Toumi. 2025. The impact of global warming on U.S. hurricane landfall: a storyline approach. Environmental Research Letters 20:114006. https://doi.org/10.1088/1748-9326/ae0956
Wiley, J. W., and J. M. Wunderle, Jr. 1993. The effects of hurricanes on birds, with special reference to Caribbean islands. Bird Conservation International 3:319-349. https://doi.org/10.1017/S0959270900002598
Winkler, D. W., S. M. Billerman, and I. J. Lovette. 2020. Gnatcatchers (Polioptilidae), version 1.0 in S. M. Billerman, B. K. Keeney, P. G. Rodewald, and T. S. Schulenberg, editors. Birds of the world. Cornell Lab of Ornithology, Ithaca, New York, USA. https://doi.org/10.2173/bow.poliop1.01
Wulder, M. A., T. R. Loveland, D. P. Roy, C. J. Crawford, J. G. Masek, C. E. Woodcock, R. G. Allen, M. C. Anderson, A. S. Belward, W. B. Cohen, et al. 2019. Current status of Landsat program, science, and applications. Remote Sensing of Environment 225:127-147. https://doi.org/10.1016/j.rse.2019.02.015
Wunderle, J. 2005. Hurricanes and the fate of Caribbean birds—what do we know, what do we need to know, who is vulnerable, how can we prepare, what can we do, and what are the management options? Journal of Caribbean Ornithology 18:94-96.
Wunderle, J. M. 1994. Métodos para contar aves terrestres en el Caribe. General Technical Report SO-100. U.S. Forest service, Southern Forest Experiment Station, New Orleans, Louisiana, USA.
Fig. 1

Fig. 1. Analysis area with counting points to detect the presence of Cuban Gnatcatcher (Polioptila lembeyei) in the eastern sector of the Siboney-Juticí Ecological Reserve, Santiago de Cuba, Cuba.
Fig. 2

Fig. 2. Detections of Cuban Gnatcatcher (Polioptila lembeyei) by point count from 2012 to 2014 in the Siboney-Juticí Ecological Reserve, Santiago de Cuba, Cuba.
Fig. 3
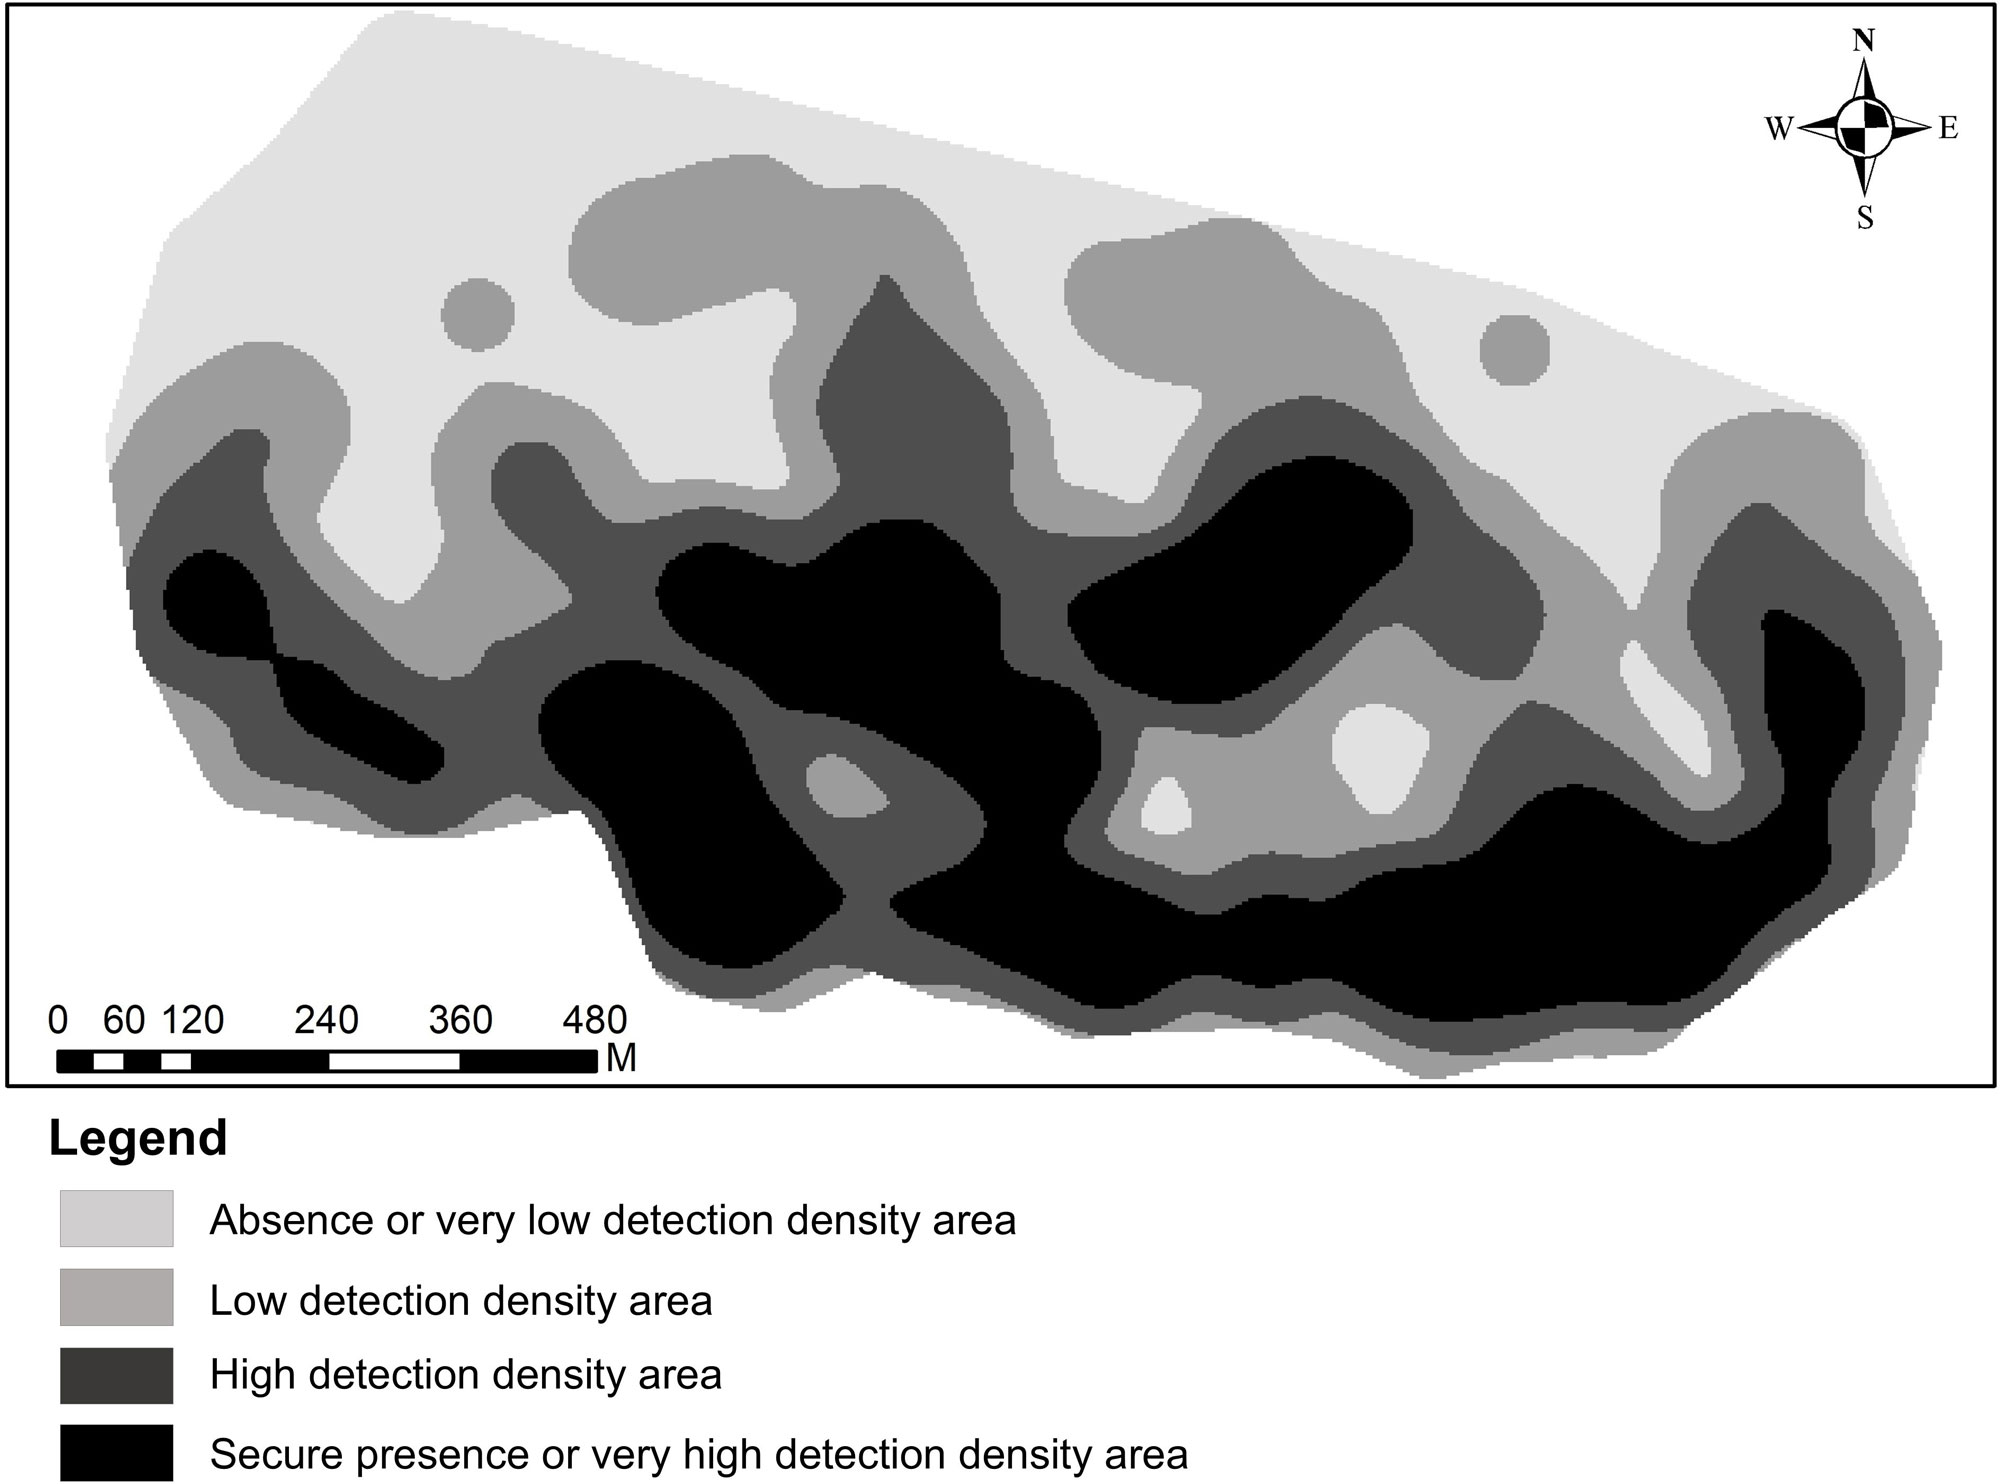
Fig. 3. Representation of the detection density of Polioptila lembeyei from 2012 to 2014 in the Siboney-Juticí Ecological Reserve, Santiago de Cuba, Cuba.
Fig. 4

Fig. 4. Cuban Gnatcatcher (Polioptila lembeyei) detection by month in 2013 and 2014 at the Siboney-Juticí Ecological Reserve, Santiago de Cuba, Cuba.
Fig. 5

Fig. 5. Representation of the detection density of Cuban Gnatcatcher (Polioptila lembeyei), during the breeding seasons and non-breeding seasons 2013 and 2014 at the Siboney-Juticí Ecological Reserve, Santiago de Cuba, Cuba.
Fig. 6
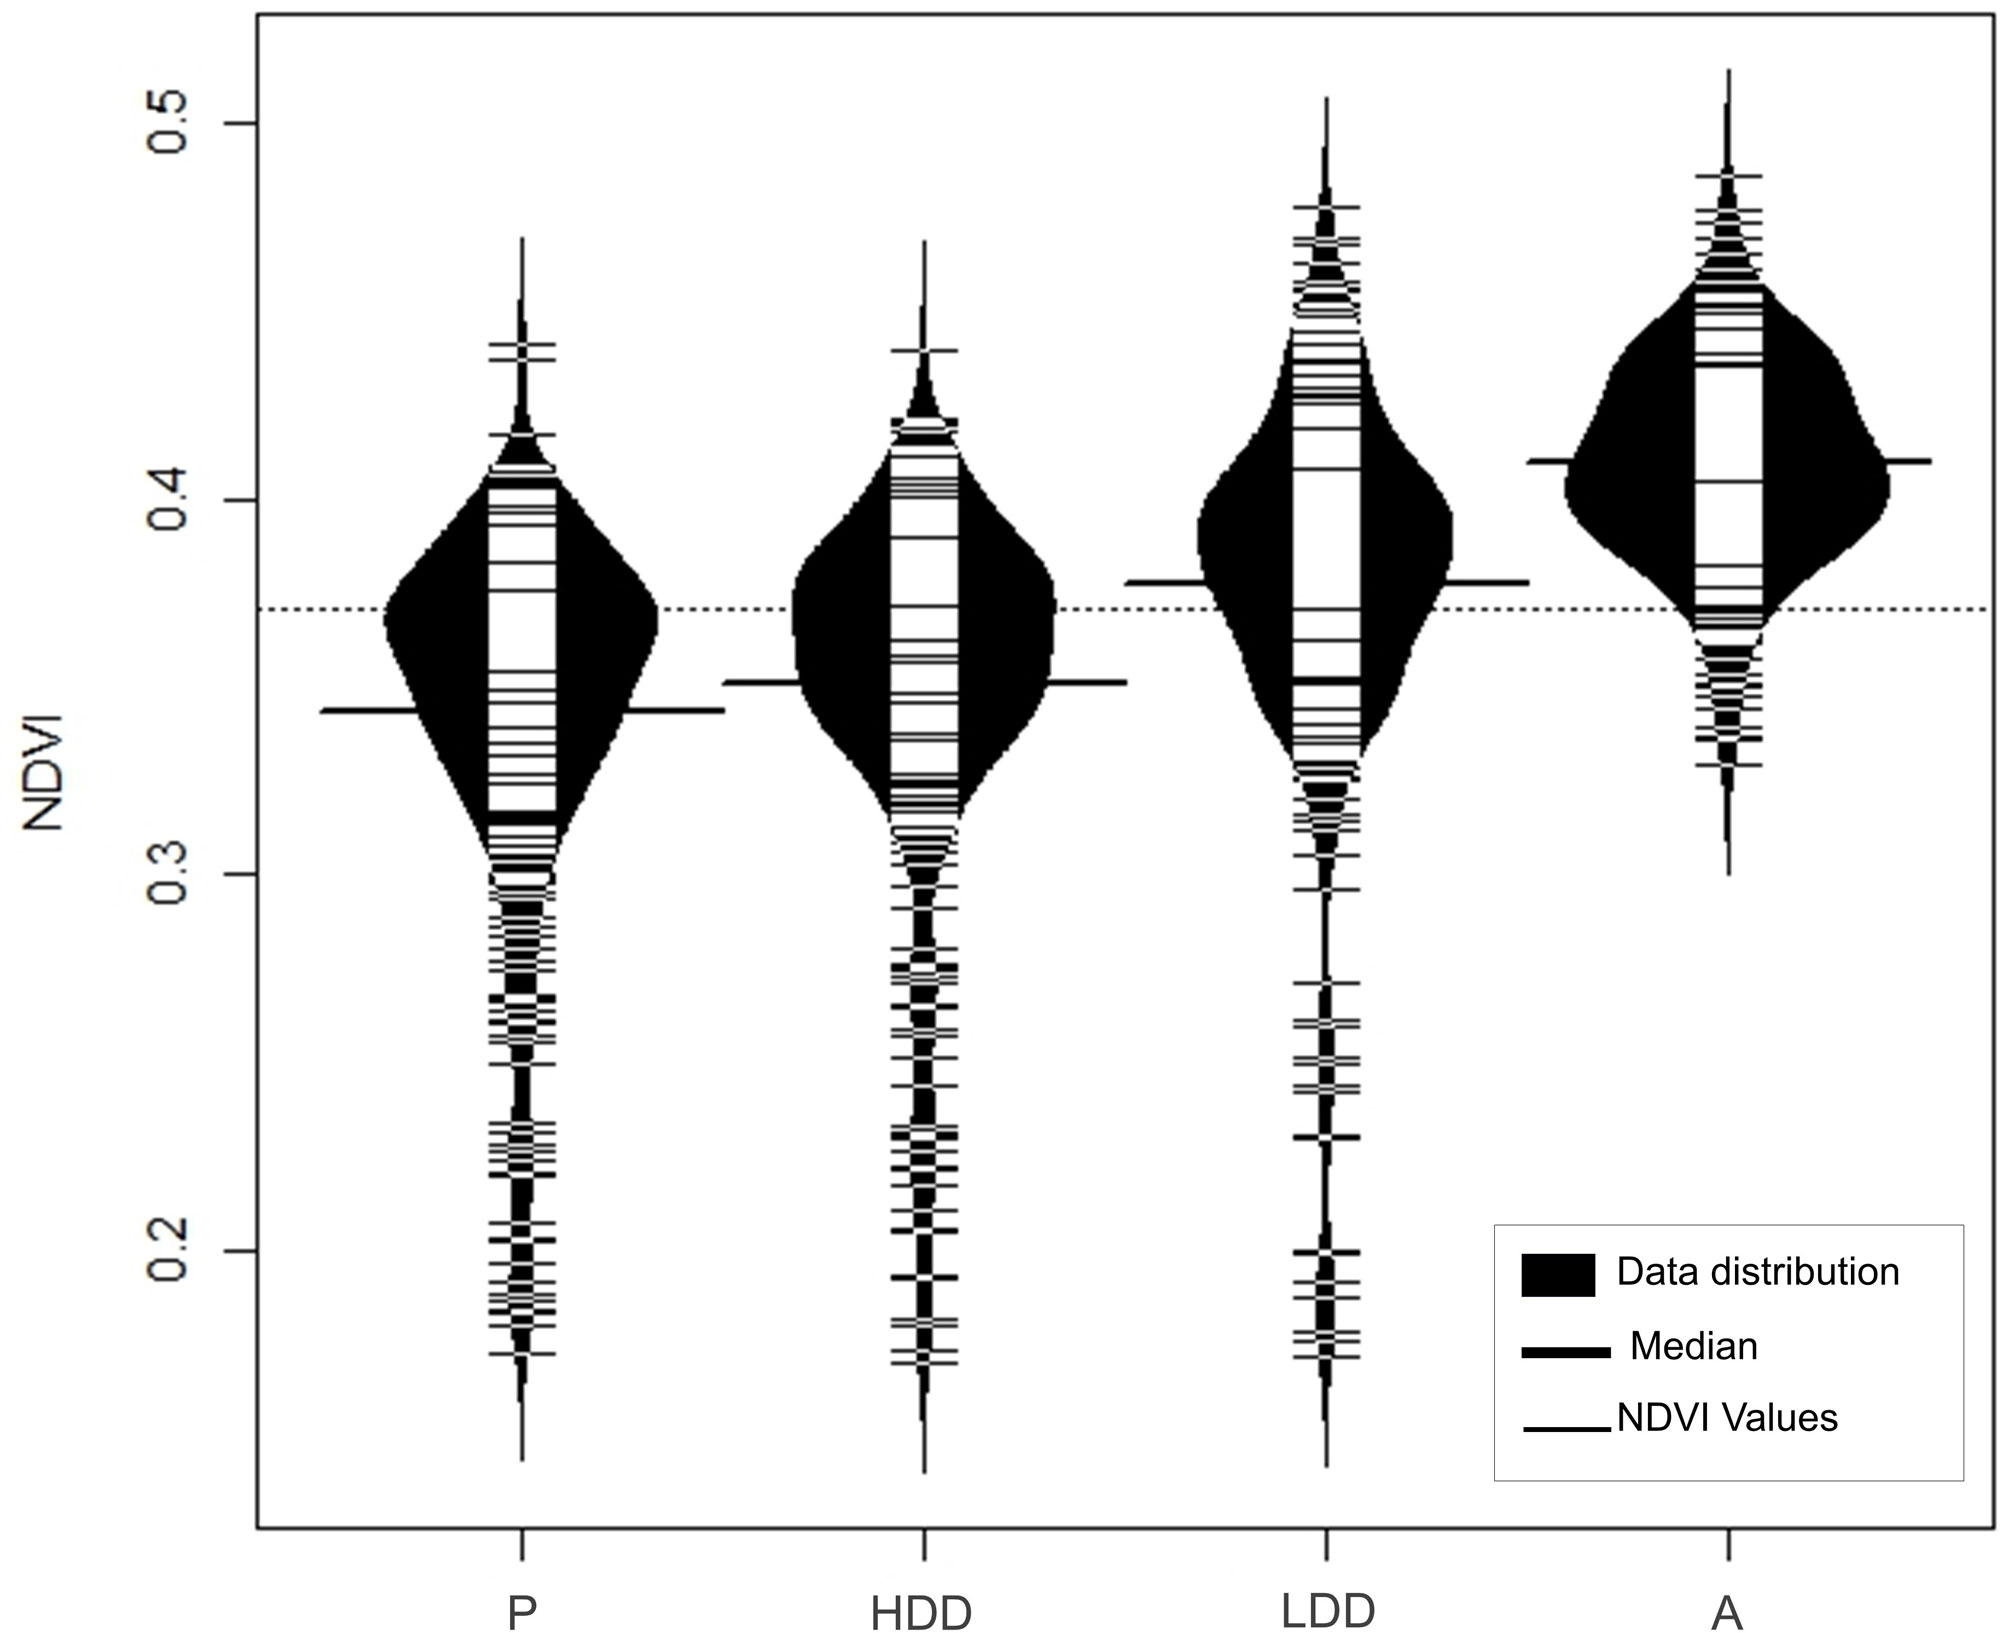
Fig. 6. NDVI (Normalized Difference Vegetation Index) values by areas of detection density of Cuban Gnatcatcher (Polioptila lembeyei) in the Siboney-Juticí Ecological Reserve (P: Presence area, HDD: High detection density, LDD: Low detection density, A: Absence).
Table 1
Table 1. Methods used to determine the spatiotemporal distribution of Polioptila lembeyei and the vegetation cover characteristics of its distribution areas in the eastern sector of the Siboney-Juticí Ecological Reserve, Santiago de Cuba, Cuba.
| Outcome | Method | Plots / sample units | Year | Replicates | |||||
| Spatial distribution | Variable-radius point count | 54 | 2012–2014 | Monthly | |||||
| Temporal distribution | Variable-radius point count | 54 | 2013–2014 | Monthly | |||||
| Absence area verification | • Variable-radius point count • Variable-radius point count combined with playback |
54 | 2016 | Weekly | |||||
| Vegetation cover characterization | Circular plots | 48 | 2012 | Single measurement | |||||
| Vegetation cover characterization | Normalized Difference Vegetation Index (NDVI) | 1100 (30x30 m pixels) | 2009–2015 | Semi-annual | |||||
Table 2
Table 2. Statistical results obtained with the Nearest Neighbor geostatistical tool in 2013 and 2014 and in the breeding and non-breeding seasons of both years in the Siboney-Juticí Ecological Reserve, Santiago de Cuba, Cuba. (NNI: Nearest Neighbor Index; z (SD): Standard deviation value of the tool; p: statistical significance value of the tool; Pattern: Spatial distribution pattern obtained).
| Years | Seasons | NNI | z (SD) | p = 0.05 | Pattern | ||||
| 2013 | Full year | 0.65 | -10.57 | 0.000 | Clustered | ||||
| Breeding | 0.79 | -4.44 | 0.000 | Clustered | |||||
| Not breeding | 0.65 | -7.58 | 0.000 | Clustered | |||||
| 2014 | Full year | 0.60 | -12.95 | 0.000 | Clustered | ||||
| Breeding | 0.66 | -7.55 | 0.000 | Clustered | |||||
| Not breeding | 0.55 | -10.46 | 0.000 | Clustered | |||||
Table 3
Table 3. Characteristics of the vegetation structure based on detection density areas for Polioptila lembeyei in the eastern sector of the Siboney-Juticí Ecological Reserve, Santiago de Cuba, Cuba.
| Vegetation cover variables | Secure presence or very high detection density area: median (max–min) | High detection density area: median (max–min) | Low detection density area: median (max–min) |
Absence or very low detection density area: median (max–min) | H (Kruskall-Wallis test) | P (P < 0.05) | |||
| Ground cover (%) | 58 (93–20) | 53 (78–33) | 63 (90–45) | 60 (88–28) | 4.3 | 0.23 | |||
| Canopy cover (%) | 68 (98–33) | 60 (93–45) | 85 (98–75) | 93 (98–60) | 11.2 | 0.01 | |||
| Vertical density (0–30 cm) (%) | 100 (100–73) | 100 (100–75) | 100 (100–100) | 100 (100–100) | 1.3 | 0.72 | |||
| Vertical density (30–100 cm) (%) | 100 (100–40 | 100 (100–78) | 100 (100–100 | 100 (100–100) | 6.9 | 0.74 | |||
| Vertical density (100–200 cm) (%) | 100 (100–66) | 100 (100–94) | 100 (100–100) | 100 (100–89) | 2.4 | 0.48 | |||
| Vertical density (200–300 cm) (%) | 100 (100–70) | 100 (100–88) | 100 (100–65) | 100 (100–95) | 2.9 | 0.41 | |||
| Number of branches | 275 (602–127) | 253 (434–141) | 312 (442–103) | 236 (580–121) | 1.6 | 0.65 | |||
| Number of trees | 16 (38–0) | 21 (41–0) | 36 (65–9) | 55 (67–10) | 13.4 | 0.004 | |||
| P. lembeyei detections within vegetation plots | 12 (32–5) | 5 (7–2) | 1 (3–0) | 0 (1–0) | 41.5 | > 0.001 | |||