





The following is the established format for referencing this article:
Wu, Z., and N. Perlut. 2026. Conserved migration strategies despite contrasting reproductive success in two neighboring Bobolink populations in the northeastern U.S. Journal of Field Ornithology 97(3):4.ABSTRACT
Understanding how carry-over effects link different stages of the annual cycle is essential for conserving declining migratory birds. We investigated the full annual-cycle movements of two Bobolink (Dolichonyx oryzivorus) populations breeding ~280 km apart in contrasting-quality habitats in the northeastern United States using archival light-level geolocators recovered from 14 individuals. Populations differed dramatically in nest success (62% vs. < 5%), allowing us to test carry-over effects from reproductive success on migratory timing and performance during both fall and spring migration. We found weak migratory connectivity between breeding populations at each stage of their annual cycle, including their use of three distinct strategies for crossing the west Atlantic. Despite the disparity in breeding outcomes on the population level, we found no difference in fall migration timing or performance metrics (migration duration, stopover duration) at the population level. Spring migration was notably faster than fall migration, with birds completing the northbound journey in approximately half the time. Our findings highlight substantial phenotypic variation in Bobolink migration and suggest that conservation strategies must account for variations in migratory behavior and the multiple pathways connecting breeding and wintering areas.
RESUMEN
Entender cómo los efectos de arrastre vinculan diferentes etapas del ciclo anual es esencial para conservar aves migratorias en declive. Investigamos los movimientos del ciclo anual completo de dos poblaciones de Charlatán (Dolichonyx oryzivorus) que se reproducen a unos 280 km de distancia entre sí, en hábitats de calidad contrastante del noreste de Estados Unidos, mediante geolocalizadores basados en niveles de luz recuperados de 14 individuos. Las poblaciones difirieron marcadamente en el éxito de los nidos (62% vs. < 5%), lo que nos permitió evaluar los efectos de arrastre del éxito reproductivo sobre el momento y el desempeño de la migración, tanto durante la migración otoñal como durante la primaveral. Encontramos una débil conectividad migratoria entre las poblaciones reproductivas en las distintas etapas de su ciclo anual, incluyendo el uso de tres estrategias diferentes para atravesar el Atlántico occidental. A pesar de la marcada diferencia en los resultados reproductivos a nivel poblacional, no encontramos diferencias entre poblaciones en el momento de la migración otoñal ni en las métricas de desempeño migratorio (duración de la migración y de las paradas). La migración primaveral fue notablemente más rápida que la otoñal y las aves completaron el desplazamiento hacia el norte aproximadamente en la mitad del tiempo. Nuestros resultados ponen de manifiesto una considerable variación fenotípica en las estrategias migratorias del Charlatán y sugieren que las estrategias de conservación deben contemplar las variaciones en el comportamiento migratorio y las múltiples vías que conectan las áreas de reproducción y de invernada.
INTRODUCTION
Bird migration is a complex behavioral phenomenon shaped by a combination of genetic, physiological, and environmental factors (Alerstam et al. 2003, Winger et al. 2014). Through migration, birds naturally alternate between periods of relative residency and large-scale directional movements, giving rise to a cyclical annual pattern that links geographically distant breeding and non-breeding areas, often separated by thousands of kilometers (Webster et al. 2002). Ecological conditions encountered during one phase of the annual cycle can influence performance and fitness during subsequent phases. These influences, known as carry-over effects, play a critical role in shaping individual fitness and population dynamics, particularly as migratory birds experience increasingly variable and rapidly changing environmental conditions across their annual cycle (Norris et al. 2004, Harrison et al. 2011).
The most extensively studied pattern among migratory birds breeding in the Northern Hemisphere involves how wintering conditions and spring migration timing influence arrival on the breeding grounds and subsequent nesting success (Norris et al. 2004, Winger et al. 2014), with earlier arriving individuals generally achieving higher reproductive success (Smith and Moore 2005, Morrison et al. 2019). More recently, studies have begun to examine how breeding performance influences fall migration, showing that earlier completion of breeding is often associated with earlier departure on fall migration (Catry et al. 2013, van Wijk et al. 2017, Imlay et al. 2021), a pattern hypothesized to be advantageous by giving individuals more time and allowing them to avoid harsh weather conditions later in the season (Mitchell et al. 2012). However, other studies have found no relationship between breeding timing and fall migration departure in some species (Senner et al. 2014, Monti et al. 2023), suggesting that these carry-over effects may be species-specific or context-dependent.
In addition to carry-over effects, migratory connectivity represents another fundamental concept in migration ecology, describing how breeding populations are geographically linked to specific non-breeding regions (Webster et al. 2002). High migratory connectivity occurs when individuals from the same breeding area migrate to the same non-breeding region, whereas weak connectivity reflects extensive mixing of individuals from different breeding populations during the non-breeding season. Migratory connectivity can be shaped by multiple factors, including geographic barriers, species’ distribution ranges, and migratory strategies (Finch et al. 2017, Nourani et al. 2018, Norevik et al. 2020).
Understanding the strength of migratory connectivity has important ecological and conservation implications. From a management perspective, strong connectivity allows population-specific strategies, whereas weak connectivity often requires range-wide approaches (Cohen et al. 2017). From an evolutionary standpoint, strong connectivity can facilitate rapid local adaptation by consistently exposing populations to specific selective pressures, but it may also reduce genetic variation that shape migratory behavior, potentially limiting populations’ ability to respond to large-scale environmental changes such as climate change (Webster et al. 2002).
Bobolink (Dolichonyx oryzivorus), a ~30 g New World blackbird, is a grassland specialist that undertakes one of the most extensive migrations among North American songbirds, traveling approximately 20,000 km annually between their breeding and non-breeding grounds (Perlut 2018, Renfrew et al. 2020). Bobolink populations have experienced persistent declines of 1.7% annually from 1966 to 2022 across their breeding range, resulting in a cumulative population reduction of 62% over a 56-year survey period (Ziolkowski et al. 2023).
Renfrew et al. (2013) examined Bobolink migratory connectivity across breeding populations distributed along an east-west gradient in North America and found evidence of extensive population mixing (i.e., weak connectivity) during the non-breeding season. This observation aligns with genetic evidence from Renfrew et al. (2022), who, despite identifying four distinct genetic groupings, found low levels of genetic differentiation across the breeding range. The parallel patterns of weak migratory connectivity and genetic homogeneity are consistent with the understanding that migratory behavior has a strong genetic basis (Helbig 1991).
Although these studies have significantly advanced our understanding of Bobolink’s migratory patterns, no study has looked at the related carry-over effect between breeding outcome and migration in Bobolinks. Fine-scale comparisons of migration ecology between closely situated breeding populations also remain unexplored; for example, the closest populations in Renfrew et al. (2019) were about 600 km apart longitudinally. Investigating whether proximate breeding populations with different habitat characteristics and breeding success exhibit distinct migration strategies could shed light on the factors influencing migration decisions in this long-distance migrant.
In this study, we compared the fall and spring migration ecology of two Bobolink populations breeding approximately 280 km apart in the northeastern United States in grasslands of contrasting quality. One population bred in large, continuous hayfield patches characterized by high nest success, while the other nested in a small, isolated patch experiencing extremely high predation and therefore low reproductive success. Although these two populations are geographically close and belong to the same genetic subunit (Renfrew et al. 2022), contrasting reproductive success could still plausibly generate differences in migratory behavior by influencing breeding-ground condition or departure timing, which could in turn influence migratory routes and the degree of connectivity between breeding and nonbreeding areas. We therefore analyzed three aspects of their migratory ecology: connectivity, timing, and performance. We hypothesized:
- Connectivity: Bobolinks would show weak migratory connectivity between the two populations because of their geographic proximity and genetic similarity, which would be reflected in overlapping migratory routes and similar ocean-crossing strategies.
- Timing: Bobolinks breeding in the low-quality habitat would depart for their fall migration earlier because nest failure would lead to earlier completion of reproduction. Because second broods are not common (Gavin 1984, Renfrew et al. 2020), this would free Bobolinks from parental duties earlier than those in the high-quality habitat. No difference in migration timing was expected in the spring.
- Performance: migration performance, including stopover allocation and total migration duration, was expected to be similar between populations, as we hypothesized that nest failure was more likely to influence the timing of migration than the amount of fuel storage or flight capacity.
METHODS
Study area
In the northeastern U.S., Bobolinks almost exclusively nest in pastures and hayfields on agricultural lands (Perlut et al. 2006). Our high-quality site was Shelburne Farms in Shelburne, Vermont (44.39° N, 73.26° W; hereafter VT). Our low-quality site was the Hudson Valley Farm Hub in Hurley, New York (41.91° N, 74.09° W; hereafter NY), 283 km linear distance apart (Fig. 1). Because individual nesting outcomes were not monitored for all tracked birds, we interpreted differences between populations as reflecting population-level variation in reproductive success.
The Vermont site comprised approximately 800 ha of continuous, actively managed hayfields supporting a well-established population of > 100 breeding Bobolink pairs. Hayfield management occurred on most fields during the breeding season, with mowing between mid-May and early July. These fields were composed of alfalfa (Medicago sativa), red clover (Trifolium pratense), white clover (Trifolium repens), dandelion (Taraxacum officinale), orchard grass (Dactylis glomerata), timothy (Phleum pratense), bluegrass (Poa sp.), reed canary grass (Phalaris arundinacea), and vetch (Vicia sp.). One additional field, which included sedge (Carex spp.) and bedstraw (Galium sp.), was mowed after the breeding season. The average nest success rate was 62% in this population during this study (authors, unpublished data).
The NY site consisted of one isolated 8 ha grassland field (largely Kernza, Thinopyrum intermedium) on a farm that included 600 ha of row crops, with forested mountains to the west and urban development and highway infrastructure to the east. We regularly observed flocks of over 50 Bobolinks in this field in April and August, but fewer than eight pairs per year chose to nest there. This field was not mowed during the breeding season, but because of its very high edge density, predation risk was extremely high. More than 95% of nests were depredated over the duration of this study.
Bird capture and tracking
In May 2022 and 2023, we captured 53 adult Bobolinks at both study sites using mist nets (2022: 14 in VT and 11 in NY; 2023: 17 in VT and 11 in NY). For one day, we placed 20–30 12 m mist nets across each field from 04:00 to 12:00 to passively catch birds. We then caught birds opportunistically at nests or with a playback. Each bird was confirmed as breeding status by examining the cloacal protuberance for males and brood patch for females. We fitted each bird with an archival light-level geolocator unit (0.65 g; Migrate Technology, Cambridge, UK) using a leg-loop harness (Rappole and Tipton 1991). The total mass of the geolocator and harness was < 3% of each bird’s body mass.
In 2023 and 2024, we successfully retrieved 14 geolocators from the respective previous year: seven from VT (3 in 2023, 4 in 2024) and seven from NY (6 in 2023, 1 in 2024). One bird from each site was tracked for two years. Although this replication could introduce potential non-independence in the dataset, we treated all migration tracks as independent given our small sample size (n = 14) and because visual comparison of the two repeat tracks showed substantial year-to-year variation in routes, suggesting individual flexibility rather than fixed migratory programs.
Analysis of tracking data
All statistical tests were conducted in R version 4.4.1 (R Core Team 2024). Following Perlut (2018) and Lisovski et al. (2020), we downloaded and formatted raw twilight data using IntiProc v1.03 (Migrate Technology) and identified sunrise and sunset times with the “BAStag” package, applying a light threshold of 1.0. After visual inspection to remove unrealistic dawn/dusk times, we proceeded with location analysis using the FlightR package (Rakhimberdiev et al. 2017), with calibration periods based on known breeding locations. FlightR uses a hidden Markov chain model to estimate the location of migrating animals at dawn and dusk (Rakhimberdiev et al. 2015). This dual calibration approach allowed us to account for potential sensor degradation over time. We ran the model with 106 particles and prohibited birds from remaining stationary over water bodies.
Bobolinks inhabit open habitat throughout the year, experiencing minimal shading issues compared to forest-dwelling species (Lisovski et al. 2020). The resulting clearer estimates of dawn and dusk improve geolocation accuracy, with errors of less than 50 km reported during the breeding season when birds occupy known locations (Renfrew et al. 2019). Despite this advantage, we still followed established geolocator analysis protocols by focusing exclusively on migration movements > 200 km to ensure reliable detection (Fudickar et al. 2012, Lisovski et al. 2012). To address the challenge of estimating latitude around equinoxes, we excluded latitude data within 15 d of the fall and spring equinox and relied solely on longitude to infer movement during these periods (Phillips et al. 2004).
Following location estimation, we used FlightR to identify periods of stasis and movement. For each bird, we extracted stopover and wintering locations and calculated departure and arrival times for fall and spring migrations, as well as ocean crossing events (Perlut 2018). For our timing analysis, we used quantile (Q50) arrival and departure dates to ensure consistent estimates across individuals.
Migration connectivity
To quantify the strength of migratory connectivity, we employed Mantel correlation coefficients (Ambrosini et al. 2009) using the “ade4” package in R (Dray and Dufour 2007). We first applied the traditional approach by constructing two distance matrices: one representing the geographic distances between each pair of our 14 tracked birds during the breeding season, and another representing pairwise distances between all individuals on their non-breeding grounds. We then used random permutations to estimate the Mantel correlation coefficient (ranging from −1 to 1) and its associated p value. A strong positive correlation between these matrices indicated high migratory connectivity, where birds breeding in proximity wintered near each other. Conversely, values near zero indicated weak connectivity, whereas negative values indicated that birds breeding near each other wintered farther apart, demonstrating population mixing (Ambrosini et al. 2009).
We extended this traditional method by incorporating two additional distance matrices representing bird distributions at critical water crossing locations during southward (over the western Atlantic Ocean) and northward (over the Caribbean Sea) migration. This expansion was motivated by the observation that, despite all Bobolinks utilizing the “Atlantic flyway,” individuals exhibited distinct overwater flight strategies (Perlut 2018). By including these supplementary matrices, we investigated partial connectivity on their migration (e.g., whether individuals from the same breeding sites employed similar route selection strategies during these overwater flights).
Each of the four matrixes consisted of a 14×14 table where individual cells represented the geographic distance between pairs of birds at that stage of the annual cycle. We conducted Mantel tests with 999 permutations for all six possible pairwise comparisons between our four matrices (breeding, southward ocean, northward ocean, and non-breeding) to determine whether spatial arrangements of individuals relative to each other were correlated across different annual cycle periods. For example, we examined whether birds breeding in proximity also wintered near each other, or whether birds crossing the ocean at similar locations in southward migration also utilized similar crossing locations in northward migration. This comprehensive analytical approach allowed us to quantify connectivity strength between multiple stages of the annual cycle, providing insights into the degree of population mixing throughout migration.
Migration timing and performance
To quantify migration timing and performance, we extracted six core metrics for each individual during each migration season (Table 1) and tested for site-level differences in every metric using Mann-Whitney U tests (Wilcoxon rank-sum tests). Given the small sample size (n = 7 per site), we used non-parametric tests to avoid assumptions of normality and increase robustness to outliers. We report unadjusted p values with α = 0.05, acknowledging that multiple comparisons may increase the risk of Type I error.
RESULTS
Overall migration pattern
Bobolinks departed their breeding grounds during fall migration between 24 August and 27 September. During fall migration, they exhibited three distinct routes across the Atlantic Ocean to reach the Caribbean: (1) departing from eastern Canada or New England with a stopover in Bermuda, (2) departing from the mid-Atlantic coast near the Carolinas, or (3) continuing south along the coastline before crossing open water in Florida (Fig. 2B). All individuals subsequently crossed the Caribbean Sea and made a prolonged stopover in Venezuela and Colombia before continuing to their final non-breeding destinations. Fall migration averaged 80 d (range: 48–121 d) and covered a mean distance of 7800 km (range: 6800–9100 km).
Bobolinks spent the non-breeding season across a broad region encompassing Bolivia, Paraguay, and Argentina for an average of 141 d (range: 123–163 d). Spring migration commenced between 16 March and 9 May, with individuals departing their non-breeding grounds and traveling northward. Spring routes largely overlapped among individuals and were completed in approximately half the time of fall migration, averaging 40 d (range: 27–62 d) over 7400 km (range: 6800–9400 km). Birds arrived at breeding grounds between 8 May and 11 June.
Migratory connectivity
There was no significant spatial correlation between any paired location period (Mantel test; all p > 0.05; Table 2). Correlation coefficients ranged from −0.251 to 0.129, indicating weak to negligible connectivity and some degree of population mixing across all seasonal transitions. This non-significant spatial correlation indicates that birds breeding in proximity to one another did not maintain spatial associations during migration or on non-breeding grounds (Fig. 2A). Similarly, birds that selected comparable fall ocean departure regions—Canada to Bermuda, the mid-Atlantic coast near North Carolina, or the southern route via Florida—did not necessarily use comparable crossing routes in the spring (Fig. 2B), nor did they spend the non-breeding season in proximity to each other in South America. These results indicate a lack of migratory connectivity in our two populations, suggesting that individuals from both populations followed a diverse but overlapping set of migratory routes rather than distinct population-specific pathways.
Additionally, route selection was not consistent for the same individuals across years. Repeat tracking of two individuals revealed that both birds shifted their fall ocean-crossing routes between 2022 and 2023. The NY bird transitioned from departing from the Carolinas in 2022 to a stopover in Florida in 2023 (Fig. 3A), whereas the NY bird exhibited the inverse pattern, crossing from the Carolinas in 2023 after a stopover in Florida in the previous year (Fig. 3B).
These year-to-year differences were unlikely to result from geolocator error. Although fall ocean-crossing journeys generally occurred around the fall equinox (22 September), when latitude estimates are unreliable, longitudinal estimates remain accurate during this period (Lisovski et al. 2020). Longitude is the key axis differentiating the three migration routes: birds traveling to Florida showed westward movement, whereas those departing directly from the Carolinas headed slightly east toward the Caribbean. The clear, directionally consistent longitudinal shifts observed between years for the same individuals (Fig. 3) therefore reflect genuine flexibility in route selection rather than measurement error.
Migration timing
We found no significant differences between NY and VT breeding Bobolinks in migration timing for either fall or spring season (Fig. 4). In fall, there was greater visual variation in timing, with VT birds departing earlier and crossing the ocean a week earlier than NY birds on average, but none of these differences were statistically significant. Mean (± SD) departure dates were 6 September ± 10.8 d for NY and 31 August ± 7.9 d for VT, ocean crossing dates were 1 October ± 11.2 d for NY and 24 September ± 6.5 d for VT, and arrival dates at non-breeding grounds were 16 November ± 8.4 for NY and 23 November ± 14.8 for VT (Fig. 4, top row).
In spring, migration timing of the two populations highly overlapped, with NY birds departing their non-breeding ground on 10 April ± 18.5 d and VT birds 11 April ± 13.0 d, initiating ocean crossing on 9 May ± 15.9 d for NY and 7 May ± 5.3 d for VT, and arriving at their breeding grounds on 21 May ± 12.8 d for NY and 18 May ± 4.5 d for VT (Fig. 4, bottom row).
Migratory performance
Only one performance variable in spring migration yielded a significant result. In fall, we failed to detect any difference in migratory performance metrics between populations, with mean total migration duration of 73.7 ± 13.3 d for NY and 85.4 ± 16.4 d for VT, number of stopovers of 6.4 ± 2.4 for NY and 7.7 ± 2.0 for VT, and average stopover duration of 10.3 d ± 2.9 for NY and 9.5 ± 2.0 d for VT (Fig. 5, top row).
In spring, overall migration duration was nearly half that of fall migration, with NY birds taking 42.6 ± 12.5 d and VT birds taking 37.3 ± 10.3 d. NY birds used 5.1 ± 1.2 stopovers and VT birds used 6.3 ± 1.3 stopovers. Average stopover duration differed between populations, with NY birds stopping for longer periods than VT birds (NY: 5.9 ± 1.8 d, VT: 3.9 ± 1.3 d; W = 41, P = 0.041, Fig. 5, bottom row).
DISCUSSION
Overall, our results showed weak migratory connectivity between Bobolinks breeding at the two sites, with individuals from both populations using overlapping migratory routes and multiple ocean-crossing strategies. We found no evidence that lower breeding success at the NY site translated into earlier fall migration departure or broader population-level differences in fall migration timing. Consistent with our predictions, migration performance, including migration duration and stopover behavior, was similar between populations.
Connectivity
As expected, individuals from the two breeding sites mixed throughout the migration journey, including in their use of three distinct strategies for crossing the western Atlantic (via Florida, the Carolinas, or Bermuda). This result reinforces earlier broad-scale tracking studies showing weak connectivity across the species’ range (Renfrew et al. 2013) and aligns with findings that weak migratory connectivity is widespread among long-distance migratory birds (Finch et al. 2017). By partitioning the journey into segments (pre- and post-ocean crossing), we confirmed that weak connectivity persists even at finer spatial scales. Birds from the two populations not only share wintering areas but also mix extensively during migration itself, as reflected in three different routes selected to cross the Atlantic Ocean, with individuals from each population using all three.
Such spatial mixing is likely facilitated by the flexibility in individual route selection, as observed in the two individuals that used different routes in 2022 and 2023 (Fig. 3), an adaptive strategy also observed in other long-distance migrants (Both 2010, López-López et al. 2014). Birds may prioritize consistent timing over consistent spatial routes during migration, allowing individuals to adjust to varying environmental conditions along the way (Vardanis et al. 2011).
Additional support for this pattern comes from Bobolinks wintering in the Galápagos Islands: low genetic relatedness among nine individuals sampled suggests they originated from multiple breeding populations across the eastern portion of the range (Perlut et al. 2023). This pattern indicates that individuals from the same breeding population likely follow divergent migratory pathways, with some individuals selecting the Galápagos as stopover sites, thereby facilitating extensive population mixing. Collectively, these findings reinforce previous evidence of the species’ adaptive migration strategies and consistently weak migratory connectivity throughout their annual cycle.
Migratory timing
Our results did not support the hypothesis that failed breeders at NY would advance the onset of fall migration. Therefore, we found no evidence of carry-over effects from reproductive success to migration timing. This contrasts with patterns documented in several migratory species where breeding outcomes influenced departure timing. For example, experimentally induced nest failure advanced migration departure in Cory’s Shearwaters (Calonectris borealis; Catry et al. 2013), whereas later breeding completion delayed migration onset in Barn Swallows (Hirundo rustica; Imlay et al. 2021), Hoopoes (Upupa epops; van Wijk et al. 2017), and Savannah Sparrows (Passerculus sandwichensis; Mitchell et al. 2012)—a species that shares breeding habitat with Bobolinks.
However, the absence of carry-over effects is not without precedent. Our results parallel findings from Hudsonian Godwits (Limosa haemastica) and European Rollers (Coracias garrulus), where breeding outcome did not influence fall migration departure dates (Senner et al. 2014, Monti et al. 2023). For long-distance migrants like Hudsonian Godwits and Bobolinks, strong selection pressure at each migratory stage and the ability to resynchronize timing at key stopover sites may prevent carry-over effects from being detected (Senner et al. 2014). Additionally, failed breeders may remain on breeding grounds for extended prospecting rather than departing early. Satellite tracking of our Bobolink populations revealed that males roam up to 17 km between grasslands during the breeding season (Wu and Perlut 2026), consistent with long prospecting movements documented in European Rollers following nest failure (Monti et al. 2023). These findings suggest that Bobolinks of the eastern populations may employ similar strategies, perhaps allocating post-failure time to prospecting and exploring behavior, which obscure carry-over effects from breeding outcome.
The absence of population differences in spring migration timing was expected. Both populations wintered at similar latitudes in South America (Fig. 2), and the ~280 km latitudinal difference between breeding sites represents only a small fraction of the total ~7000 km migration distance. Consequently, VT and NY birds likely departed wintering grounds at similar times and maintained similar migration schedules, with VT birds simply extending their final flight to reach their more northern breeding destination. This resulted in overlapping spring arrival times at both sites. Notably, spring migration duration was substantially shorter than fall migration, with birds completing the northbound journey in approximately half the time (Fig. 4). This pattern is consistent with the breeding urgency hypothesis, which reflects that spring migrants prioritize time-minimization to secure breeding territories and mates, whereas fall migrants face relaxed time constraints and may optimize for energy conservation or other factors (Nilsson et al. 2013, Schmaljohann and Eikenaar 2017).
Several methodological limitations may have influenced our results and warrant consideration. First, we used population-level breeding success rates rather than individual breeding outcomes. In VT, locating nests for all tagged individuals after banding was extremely difficult given the large population size (> 100 pairs). In NY, although we found all initial nests in our small study area, we could not track individuals that switched breeding sites following nest failure, as geolocators lack real-time tracking capability. Although second broods occur at low rates, they are certainly possible (Renfrew et al. 2020). Consequently, some VT birds may have experienced nest failure, whereas some NY birds may have relocated to unmonitored grassland patches and successfully fledged subsequent nests. The visually larger spread of fall departure dates in NY compared to VT (Fig. 4) may reflect this heterogeneity in individual breeding outcomes. Without data on individual-level breeding outcomes—including timing of nest failure, renesting attempts, and final fledging dates—comparisons based on population-average success rates likely obscured individual variation in breeding completion timing.
Second, our small sample size (n = 7 per population) limited statistical power to detect population-level differences. Given this small sample, even a single misclassified individual—for example, one NY bird that successfully renested—could substantially obscure population-level patterns in departure timing. Future studies with a larger sample size, individual-level differences in breeding success, and perhaps across more study sites with higher precision tracking technology are necessary to further test if carry-over effect exist in this species.
Migratory performance
The only significant difference we observed in migration performance between populations occurred during spring, when NY birds exhibited longer average stopover durations than VT birds. This may reflect potential differences in how birds allocated time during migration. This behavioral adjustment could support the broader logic that higher-latitude birds face greater time constraints—but highlights that such urgency may manifest not in when migration begins, but in how the birds balance flying and resting (Alerstam 2011, Schmaljohann and Both 2017). These differences in migration strategies suggest Bobolinks may adjust their migratory behaviors in response to breeding destination constraints, although the mechanisms driving these adjustments, whether they represent individual flexibility, responses to current conditions, or population-level tendencies, remain to be fully elucidated.
However, given our small sample size and multiple tests conducted for each migration season, this single significant result among six migration parameters tested should be interpreted cautiously, as it could represent a Type I error rather than a true biological pattern (Forstmeier et al. 2017). The absence of differences in most migration parameters between our study populations suggests that our hypothesis was supported, at this spatial scale: that breeding habitat characteristics exert limited influence on migration performance. Collectively, these findings suggest that migratory performance varied substantially among individuals but showed limited differentiation between the two breeding populations.
It is also important to note that, as with all geolocator studies, our results represent only individuals that survived their annual migration, returned to the breeding site, and were recaptured by us (Bridge et al. 2011, Catry et al. 2013). Our dataset therefore underrepresents individuals whose migration strategies were less effective or who experienced higher mortality during migration. For example, if low-quality breeding habitat led to delayed breeding completion through renesting attempts that in turn reduced survival during migration, our failure to detect carry-over effects may partially reflect the selective loss of individuals most affected by habitat constraints rather than the true absence of such effects.
Conservation implications
Our findings confirmed weak migratory connectivity within populations of Bobolinks on the eastern portion of their breeding range, even when considering individual-level differences in migration route selection. This weak connectivity reinforces the need for broad-scale habitat protection across the entire migratory and wintering range to effectively conserve this declining grassland species (Renfrew et al. 2013, Finch et al. 2017). This protection should encompass preserving grassland stopover habitats along major flyways, establishing protected corridors through agricultural landscapes in both North and South America, and implementing sustainable land management practices in key wintering regions of Bolivia, Paraguay, and Argentina. With individuals from different breeding areas following overlapping routes and sharing wintering grounds, localized threats in non-breeding regions could simultaneously impact the entire species’ population (Finch et al. 2017). This extensive mixing underscores the need for international conservation efforts that transcend political boundaries.
RESPONSES TO THIS ARTICLE
Responses to this article are invited. If accepted for publication, your response will be hyperlinked to the article. To submit a response, follow this link. To read responses already accepted, follow this link.
AUTHOR CONTRIBUTIONS
NGP acquired funding, designed the framework, and supervised the project. NGP and ZW conceived the study idea, collected the data. ZW developed the methodology, analyzed the data, and drafted the manuscript. Both authors reviewed and edited the final manuscript.
ACKNOWLEDGMENTS
We are grateful for the many individuals and organizations who contributed to this research. Special thanks to Dr. Noah Perlut for his guidance throughout the study, from field design and data interpretation to manuscript development. We also appreciate the thoughtful feedback and support provided by Dr. Will Kochtitzky and Dr. Steven Travis. Fieldwork was made possible by the assistance of Kathryn McGee, Anne Bloomfield, Teresa Dorado, and Conrad Vispo, as well as numerous dedicated field technicians at both study sites. We thank the staff at the Hudson Valley Farm Hub and Shelburne Farms for their logistical support, and the Editor and anonymous reviewers whose comments improved the quality of this manuscript.
DATA AVAILABILITY
All data and R code supporting the findings of this study are provided in the Appendices.
LITERATURE CITED
Alerstam, T. 2011. Optimal bird migration revisited. Journal of Ornithology 152:5-23. https://doi.org/10.1007/s10336-011-0694-1
Alerstam, T., A. Hedenström, and S. Åkesson. 2003. Long-distance migration: evolution and determinants. Oikos 103:247-260. https://doi.org/10.1034/j.1600-0706.2003.12559.x
Ambrosini, R., A. P. Møller, and N. Saino. 2009. A quantitative measure of migratory connectivity. Journal of Theoretical Biology 257:203-211. https://doi.org/10.1016/j.jtbi.2008.11.019
Both, C. 2010. Flexibility of timing of avian migration to climate change masked by environmental constraints en route. Current Biology 20(3):243-248. https://doi.org/10.1016/j.cub.2009.11.074
Bridge, E. S., K. Thorup, M. S. Bowlin, P. B. Chilson, R. H. Diehl, R. W. Fléron, P. Hartl, R. Kays, J. F. Kelly, W. D. Robinson, and M. Wikelski. 2011. Technology on the move: recent and forthcoming innovations for tracking migratory birds. BioScience 61(9):689-698. https://doi.org/10.1525/bio.2011.61.9.7
Catry, P., M. P. Dias, R. A. Phillips, and J. P. Granadeiro. 2013. Carry-over effects from breeding modulate the annual cycle of a long-distance migrant: an experimental demonstration. Ecology 94(6):1230-1235. https://doi.org/10.1890/12-2177.1
Cohen, E. B., J. A. Hostetler, M. T. Hallworth, C. S. Rushing, T. Scott Sillett, and P. P. Marra. 2017. Quantifying the strength of migratory connectivity. Methods in Ecology and Evolution 9(3):513-524. https://doi.org/10.1111/2041-210X.12916
Dray, S., and A.-B. Dufour. 2007. The ade4 package: implementing the duality diagram for ecologists. Journal of Statistical Software 22(4):1-20. https://doi.org/10.18637/jss.v022.i04
Finch, T., S. J. Butler, A. M. A. Franco, and W. Cresswell. 2017. Low migratory connectivity is common in long-distance migrant birds. Journal of Animal Ecology 86(3):662-673. https://doi.org/10.1111/1365-2656.12635
Forstmeier, W., E.-J. Wagenmakers, and T. H. Parker. 2017. Detecting and avoiding likely false-positive findings – a practical guide. Biological Reviews 92:1941-1968. https://doi.org/10.1111/brv.12315
Fudickar, A. M., M. Wikelski, and J. Partecke. 2012. Tracking migratory songbirds: accuracy of light-level loggers (geolocators) in forest habitats. Methods in Ecology and Evolution 3(1):47-52. https://doi.org/10.1111/j.2041-210X.2011.00136.x
Gavin, T. A. 1984. Broodedness in Bobolinks. Auk 101(1):179-181. https://doi.org/10.1093/auk/101.1.179
Harrison, X. A., J. D. Blount, R. Inger, D. R. Norris, and S. Bearhop. 2011. Carry-over effects as drivers of fitness differences in animals. Journal of Animal Ecology 80(1):4-18. https://doi.org/10.1111/j.1365-2656.2010.01740.x
Helbig, A. J. 1991. Inheritance of migratory direction in a bird species: a cross-breeding experiment with SE- and SW-migrating blackcaps (Sylvia atricapilla). Behavioral Ecology and Sociobiology 28:9-12. https://doi.org/10.1007/BF00172133
Imlay, T. L., H. A. R. Mann, and P. D. Taylor. 2021. Autumn migratory timing and pace are driven by breeding season carryover effects. Animal Behaviour 177:207-214. https://doi.org/10.1016/j.anbehav.2021.05.003
Lisovski, S., S. Bauer, M. Briedis, S. C. Davidson, K. L. Dhanjal-Adams, M. T. Hallworth, J. Karagicheva, C. M. Meier, B. Merkel, J. Ouwehand, et al. 2020. Light-level geolocator analyses: a user’s guide. Journal of Animal Ecology 89(1):221-236. https://doi.org/10.1111/1365-2656.13036
Lisovski, S., C. M. Hewson, R. H. G. Klaassen, F. Korner-Nievergelt, M. W. Kristensen, and S. Hahn. 2012. Geolocation by light: accuracy and precision affected by environmental factors. Methods in Ecology and Evolution 3(3):603-612. https://doi.org/10.1111/j.2041-210X.2012.00185.x
López-López, P., C. García-Ripollés, and V. Urios. 2014. Individual repeatability in timing and spatial flexibility of migration routes of trans-Saharan migratory raptors. Current Zoology 60(5):642-652. https://doi.org/10.1093/czoolo/60.5.642
Mitchell, G. W., A. E. M. Newman, M. Wikelski, and D. R. Norris. 2012. Timing of breeding carries over to influence migratory departure in a songbird: an automated radiotracking study. Journal of Animal Ecology 81:1024-1033. https://doi.org/10.1111/j.1365-2656.2012.01978.x
Monti, F., S. Barišić, S. Cannarella, D. Ćiković, V. Tutiš, J. Kralj, and C. Catoni. 2023. Breeding phase and outcome determine space use in European Rollers (Coracias garrulus) prior to migration. Current Zoology 70:137-149. https://doi.org/10.1093/cz/zoad006
Morrison, C. A., J. A. Alves, T. G. Gunnarsson, B. ϸórisson, and J. A. Gill. 2019. Why do earlier-arriving migratory birds have better breeding success? Ecology and Evolution 9:8856-8864. https://doi.org/10.1002/ece3.5441
Nilsson, C., R. H. G. Klaassen, and T. Alerstam. 2013. Differences in speed and duration of bird migration between spring and autumn. American Naturalist 181:837-845. https://doi.org/10.1086/670335
Norevik, G., S. Åkesson, T. Artois, N. Beenaerts, G. Conway, B. Cresswell, R. Evens, I. Henderson F. Jiguet, and A. Hedenström. 2020. Wind-associated detours promote seasonal migratory connectivity in a flapping flying long-distance avian migrant. Journal of Animal Ecology 89:635-646. https://doi.org/10.1111/1365-2656.13112
Norris, D. R., P. P. Marra, T. K. Kyser, T. W. Sherry, and L. M. Ratcliffe. 2004. Tropical winter habitat limits reproductive success on the temperate breeding grounds in a migratory bird. Proceedings of the Royal Society B: Biological Sciences 271:59-64. https://doi.org/10.1098/rspb.2003.2569
Nourani, E., K. Safi, N. M. Yamaguchi, and H. Higuchi. 2018. Raptor migration in an oceanic flyway: wind and geography shape the migratory route of grey-faced buzzards in East Asia. Royal Society Open Science 5:171555. https://doi.org/10.1098/rsos.171555
Perlut, N. G. 2018. Prevalent transoceanic fall migration by a 30-gram songbird, the Bobolink. Auk 135:992-997. https://doi.org/10.1642/AUK-18-56.1
Perlut, N., L. M. Maxwell, A. Kovach, P. Parker, and R. B. Renfrew. 2023. Breeding origins of a uniquely regular migrant songbird in the Galápagos Islands. Ecology and Evolution 13:e9697. https://doi.org/10.1002/ece3.9697
Perlut, N. G., A. M. Strong, T. M. Donovan, and N. J. Buckley. 2006. Grassland songbirds in a dynamic management landscape: behavioral responses and management strategies. Ecological Applications 16:2235-2247. https://doi.org/10.1890/1051-0761(2006)016[2235:GSIADM]2.0.CO;2
Phillips, R. A., J. R. D. Silk, J. P. Croxall, V. Afanasyev, and D. R. Briggs. 2004. Accuracy of geolocation estimates for flying seabirds. Marine Ecology Progress Series 266:265-272. https://doi.org/10.3354/meps266265
R Core Team. 2024. R: a language and environment for statistical computing. R Foundation for Statistical Computing, Vienna, Austria. https://doi.org/10.32614/R.manuals
Rakhimberdiev, E., A. Saveliev, T. Piersma, and J. Karagicheva. 2017. FlightR: an R package for reconstructing animal paths from solar geolocation loggers. Methods in Ecology and Evolution 8:1482-1487. https://doi.org/10.1111/2041-210X.12765
Rakhimberdiev, E., D. W. Winkler, E. Bridge, N. E. Seavy, D. Sheldon, T. Piersma, and A. Saveliev. 2015. A hidden Markov model for reconstructing animal paths from solar geolocation loggers using templates for light intensity. Movement Ecology 3:25. https://doi.org/10.1186/s40462-015-0062-5
Rappole, J. H., and A. R. Tipton. 1991. New harness design for attachment of radio transmitters to small passerines. Journal of Field Ornithology 62:335-337.
Renfrew R., D. Kim, N. Perlut, and M. D. Cadman. 2019. Migration tactics of a long-distance migratory songbird from across a continental breeding range. Wilson Journal of Ornithology 131(4):735-749. https://doi.org/10.1676/1559-4491-131.4.735
Renfrew, R. B., D. Kim, N. Perlut, J. Smith, J. Fox, and P. P. Marra. 2013. Phenological matching across hemispheres in a long-distance migratory bird. Diversity and Distributions 19:1008-1019. https://doi.org/10.1111/ddi.12080
Renfrew, R. B., N. Perlut, L. M. Maxwell, M. Cadman, D. H. Kim, G. V. Clucas, and A. I. Kovach. 2022. Population structure of a grassland songbird (Dolichonyx oryzivorus) to inform conservation units. Biodiversity and Conservation 31:77-96. https://doi.org/10.1007/s10531-021-02321-5
Renfrew, R., A. M. Strong, N. G. Perlut, S. G. Martin, and T. A. Gavin. 2020. Bobolink (Dolichonyx oryzivorus). Version 1.0 in P. G. Rodewald, editor. Birds of the world. Cornell Lab of Ornithology, Ithaca, New York, USA. https://doi.org/10.2173/bow.boboli.01
Schmaljohann, H., and C. Eikenaar. 2017. How do energy stores and changes in these affect departure decisions by migratory birds? A critical view on stopover ecology studies and some future perspectives. Journal of Comparative Physiology A 203:411-429. https://doi.org/10.1007/s00359-017-1166-8
Schmaljohann, H., and C. Both. 2017. The limits of modifying migration speed to adjust to climate change. Nature Climate Change 7:573-576. https://doi.org/10.1038/nclimate3336
Senner, N. R., W. M. Hochachka, J. W. Fox, and V. Afanasyev. 2014. An exception to the rule: carry-over effects do not accumulate in a long-distance migratory bird. PLoS ONE 9:e86588. https://doi.org/10.1371/journal.pone.0086588
Smith, R. J., and F. R. Moore. 2005. Arrival timing and seasonal reproductive performance in a long-distance migratory landbird. Behavioral Ecology and Sociobiology 57:231-239. https://doi.org/10.1007/s00265-004-0855-9
van Wijk, R. E., M. Schaub, and S. Bauer. 2017. Dependencies in the timing of activities weaken over the annual cycle in a long-distance migratory bird. Behavioral Ecology and Sociobiology 71:73. https://doi.org/10.1007/s00265-017-2305-5
Vardanis, Y., R. H. G. Klaassen, R. Strandberg, and T. Alerstam. 2011. Individuality in bird migration: routes and timing. Biology Letters 7:502-505. https://doi.org/10.1098/rsbl.2010.1180
Webster, M. S., P. P. Marra, S. M. Haig, S. Bensch, and R. T. Holmes. 2002. Links between worlds: unraveling migratory connectivity. Trends in Ecology & Evolution 17:76-83. https://doi.org/10.1016/S0169-5347(01)02380-1
Winger, B. M., F. K. Barker, and R. H. Ree. 2014. Temperate origins of long-distance seasonal migration in New World songbirds. Proceedings of the National Academy of Sciences 111:12115-12120. https://doi.org/10.1073/pnas.1405000111
Wu, Z., and N. G. Perlut. 2026. Satellite tracking reveals the home range and movement ecology across the annual cycle of a 32 g songbird. Movement Ecology 14:35. https://doi.org/10.1186/s40462-026-00662-w
Ziolkowski, D. J., Jr., M. Lutmerding, W. B. English, V. I. Aponte, and M.-A. R. Hudson. 2023. North American Breeding Bird Survey Dataset 1966-2022. U.S. Geological Survey Data Release. https://doi.org/10.5066/P9GS9K64
Fig. 1
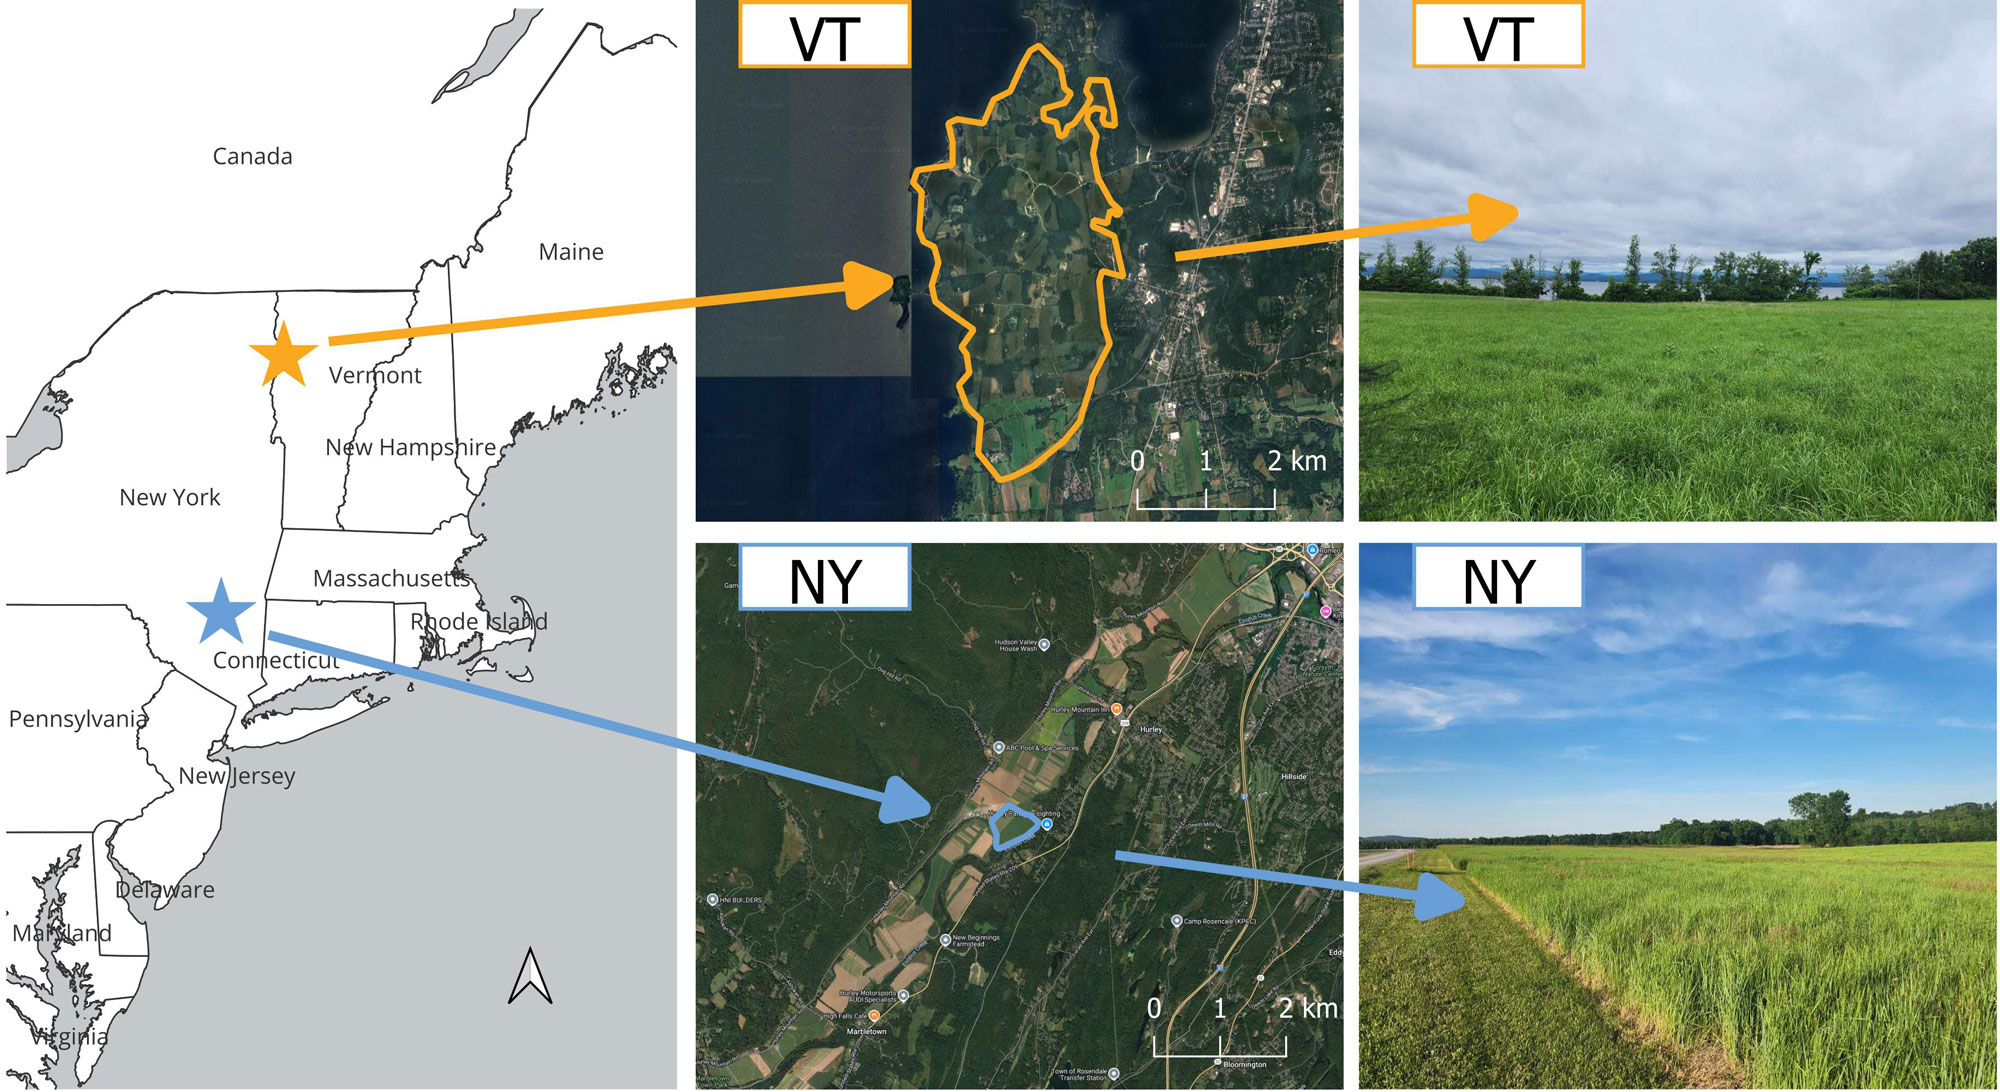
Fig. 1. Study sites for the two Bobolink breeding populations at Shelburne Farms, Vermont (44.39° N, 73.26° W; VT) and Hudson Valley Farm Hub, New York (41.91° N, 74.09° W; NY). Satellite imagery shows hayfield boundaries (outlined in orange in VT and blue in NY) at both sites, illustrating contrasting landscape heterogeneity. On-site photographs show representative habitat at each site.
Fig. 2
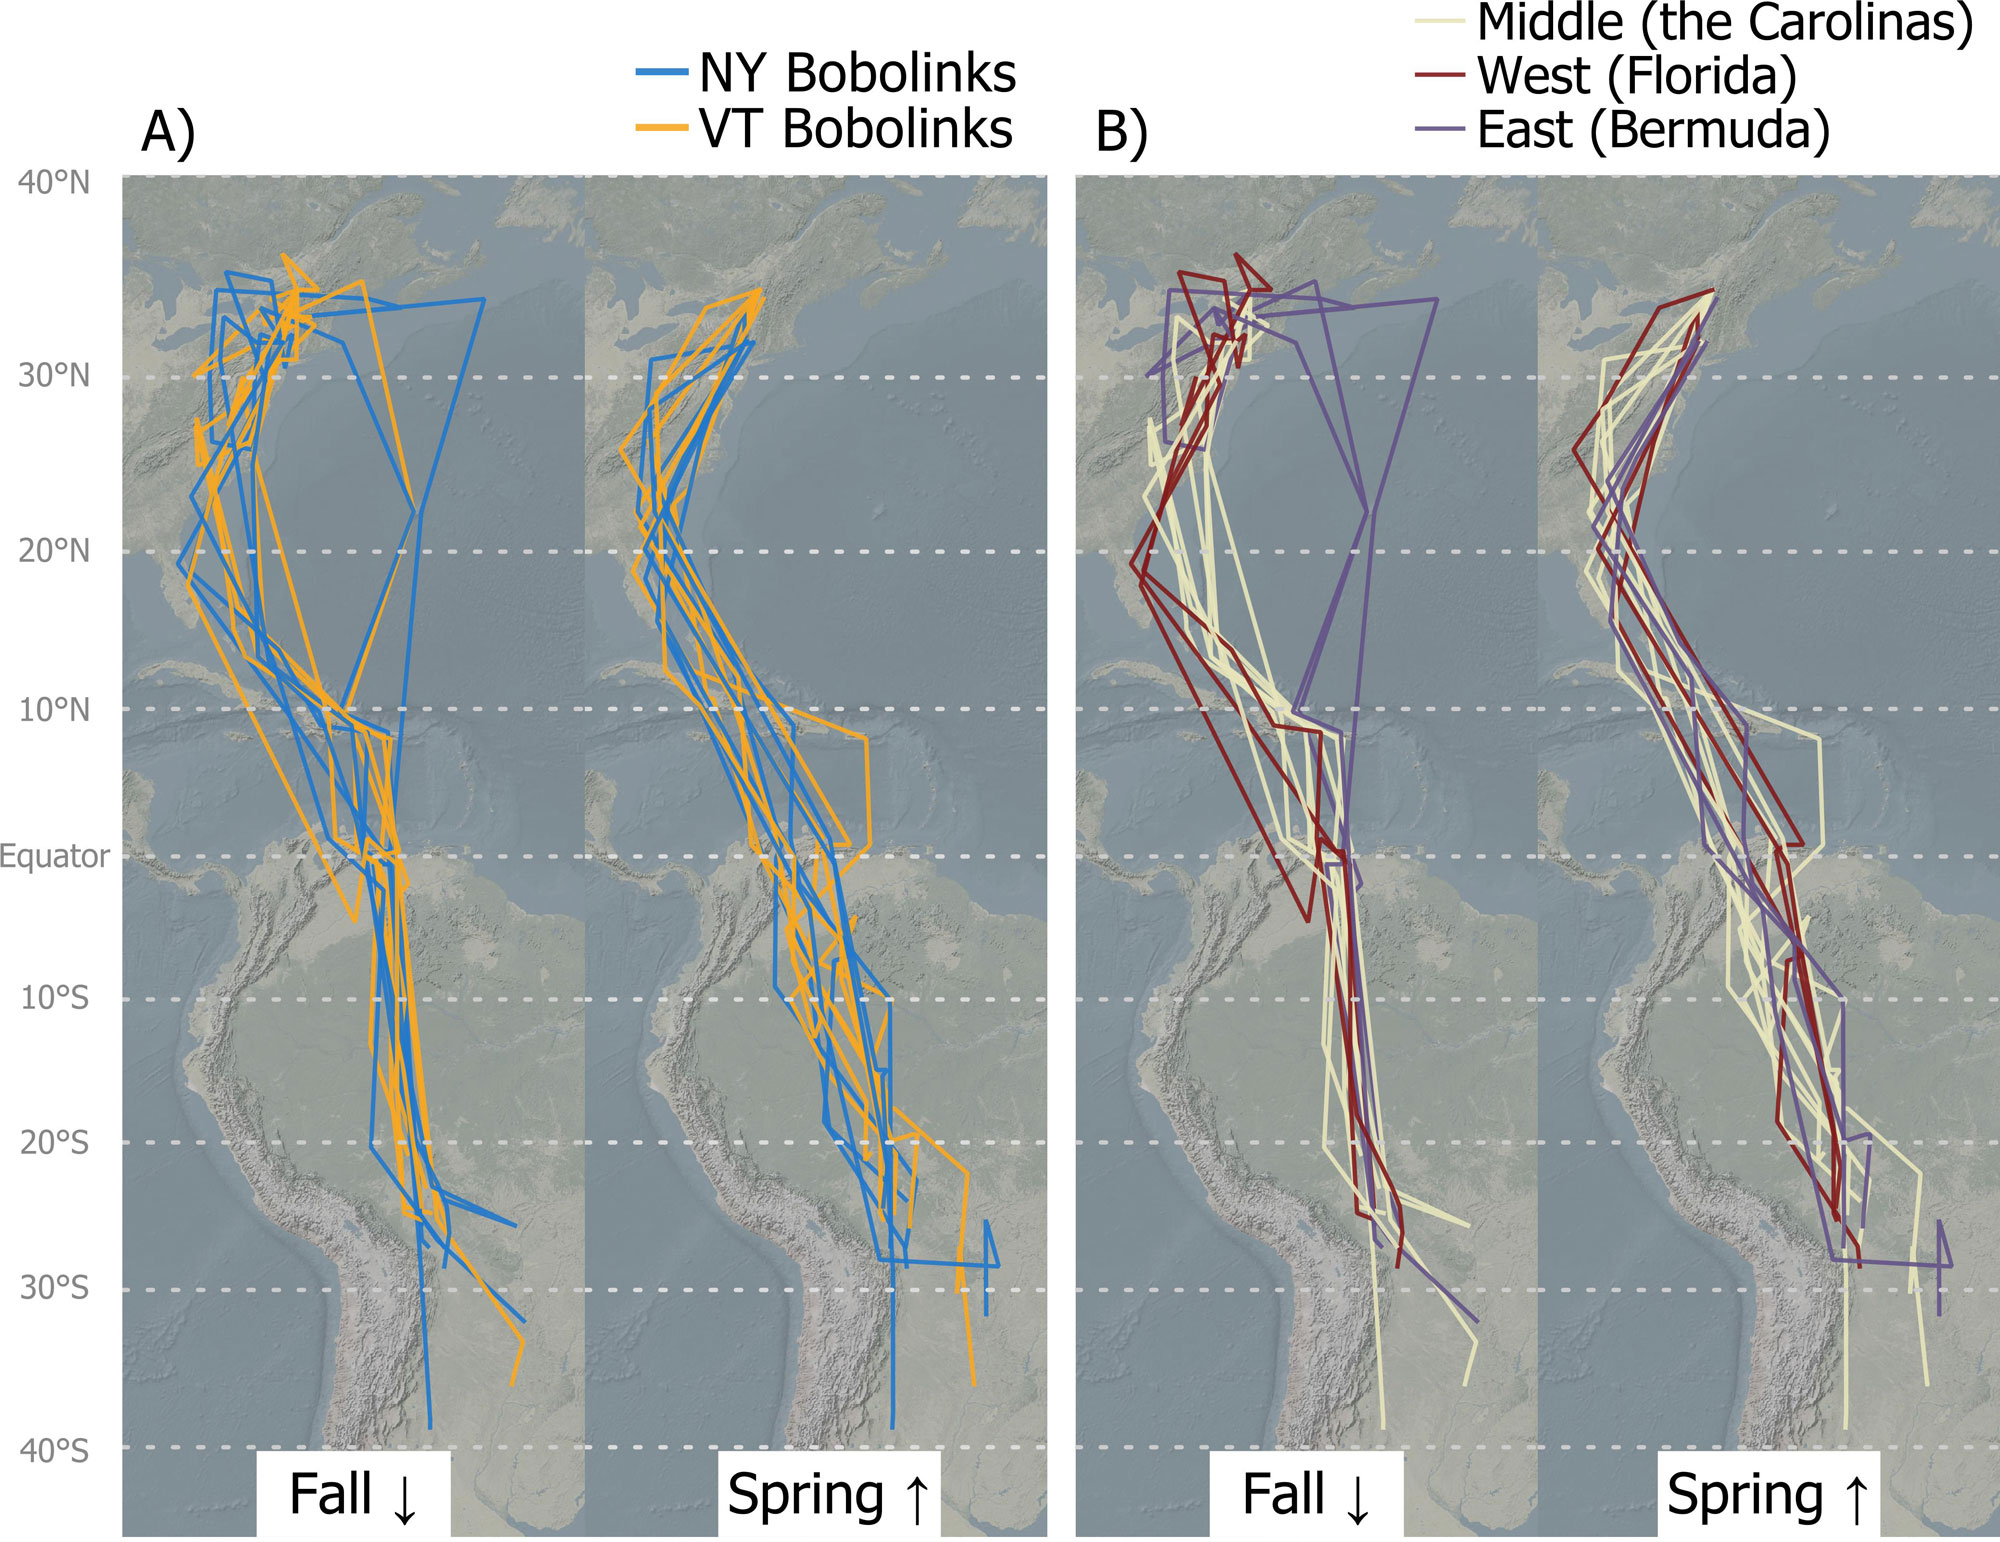
Fig. 2. Bobolink migration tracks colored by A) breeding site, with New York (NY) birds shown in blue and Vermont (VT) birds shown in orange, and B) ocean-crossing route during fall migration. Left maps show fall (southward) migration; right maps show spring (northward) migration. Arrows indicate migration direction.
Fig. 3
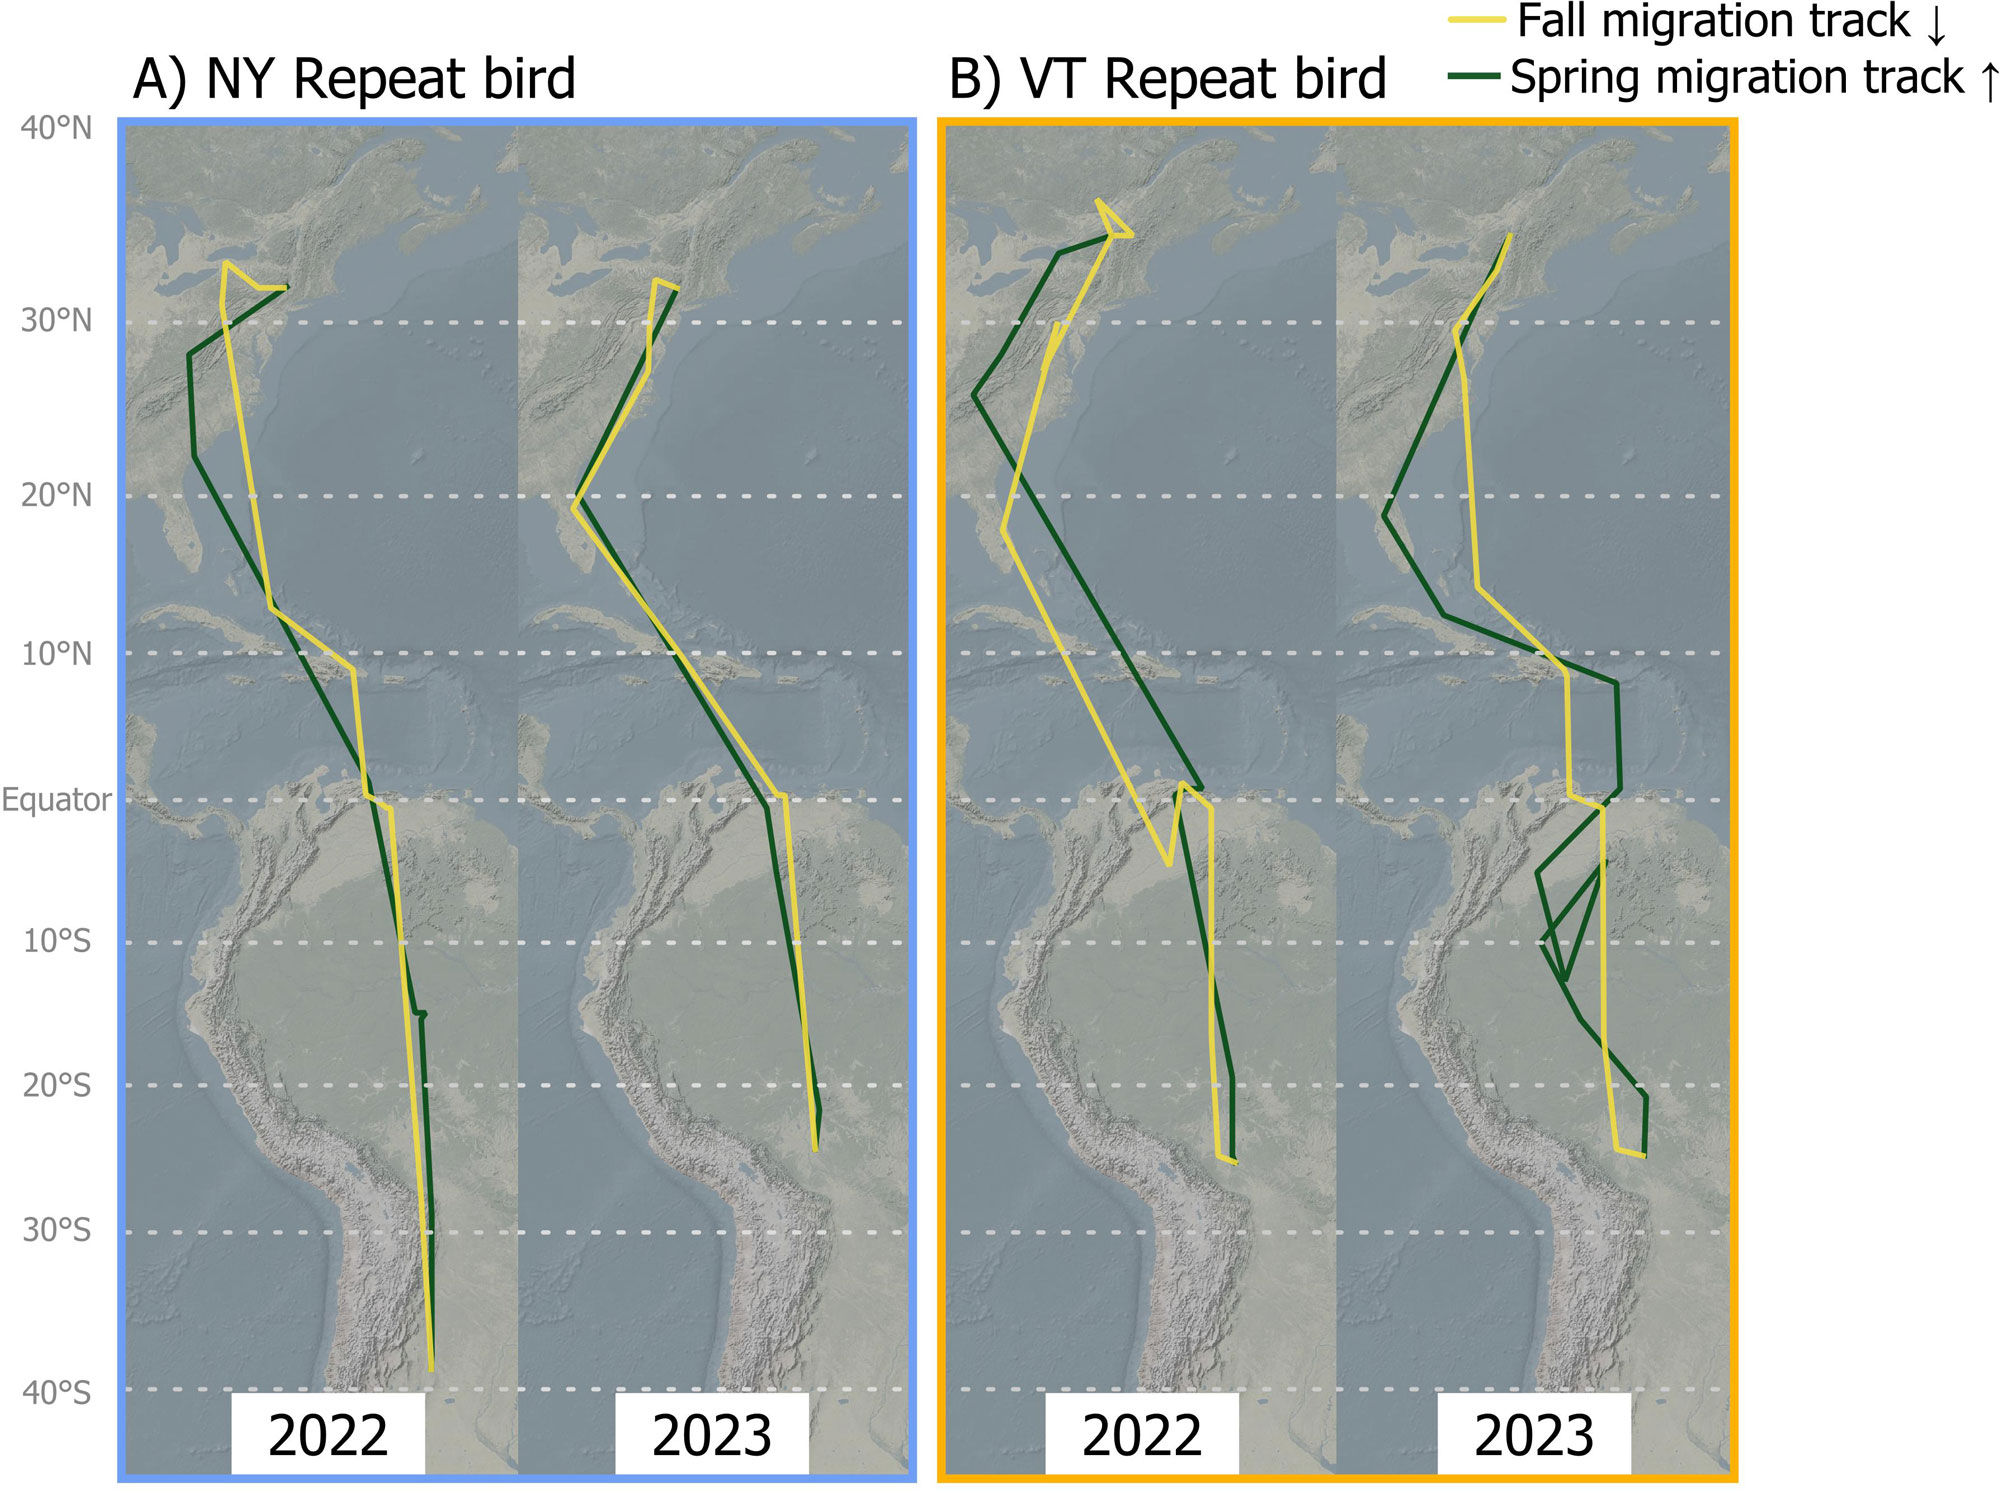
Fig. 3. Individual variation in ocean-crossing strategies of two individual Bobolinks tracked in consecutive years. The New York (NY)-tagged bird is shown on the left, and the Vermont (VT)-tagged bird is shown on the right. Fall (yellow) and spring (green) migration routes between years demonstrate flexibility in trans-Atlantic crossing strategies.
Fig. 4
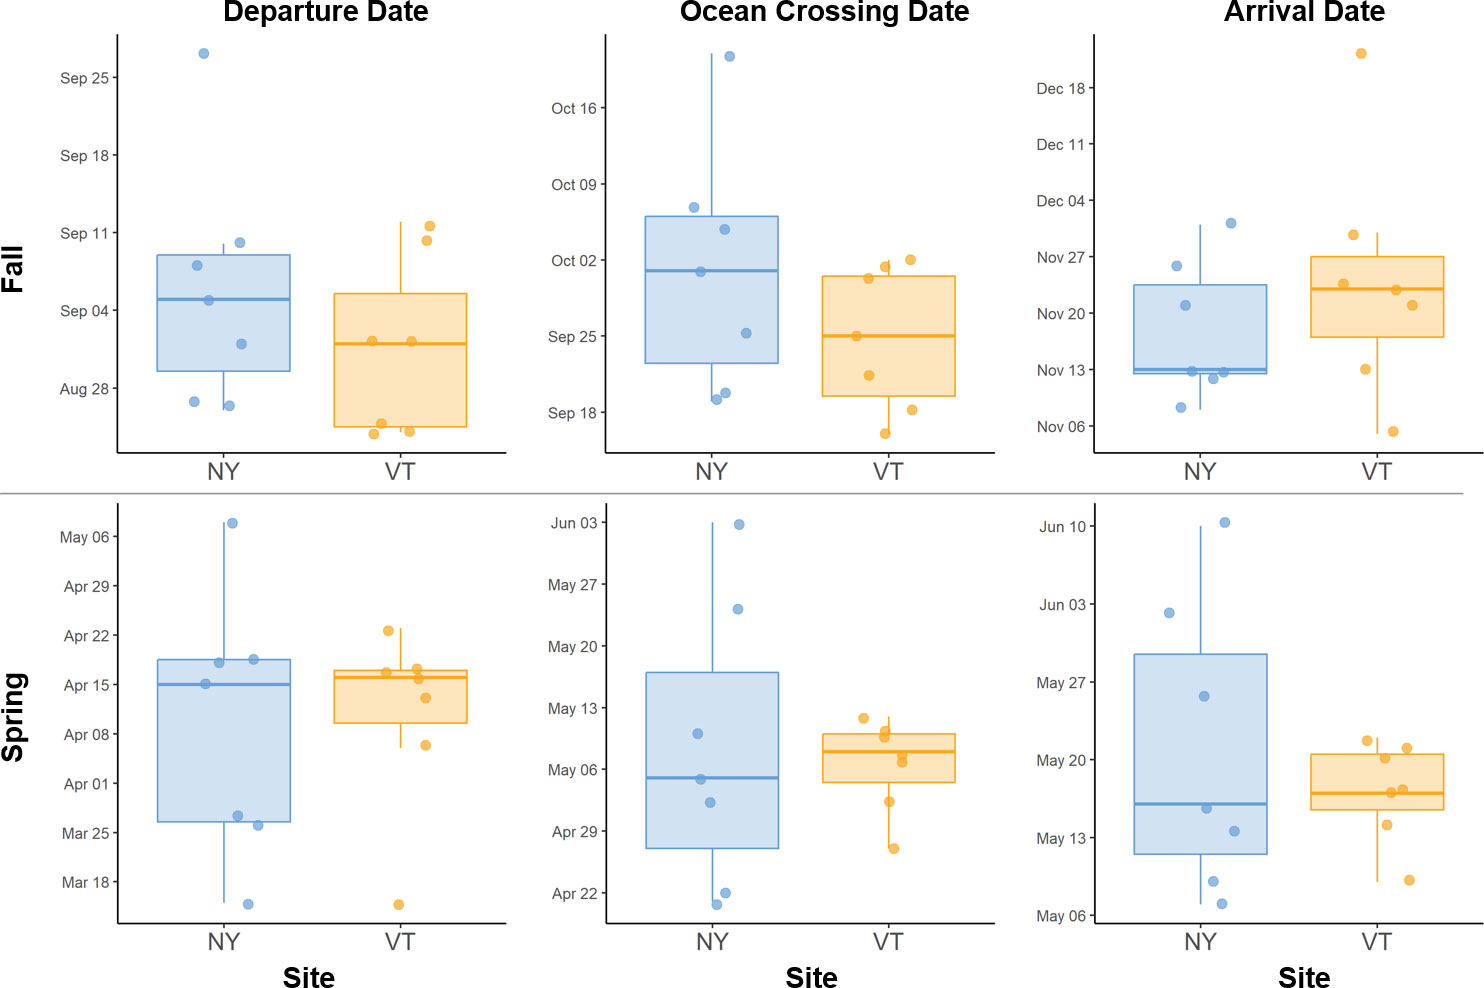
Fig. 4. Site-level differences in Bobolinks migration timing. Fall migration timing (top row) and spring migration timing (bottom row) for seven New York (blue) and seven Vermont (orange) Bobolinks, showing departure date (left column), ocean-crossing date (middle column), and arrival date (right column). No significant differences were detected between sites for any migration timing metric (P > 0.05 for all comparisons).
Fig. 5
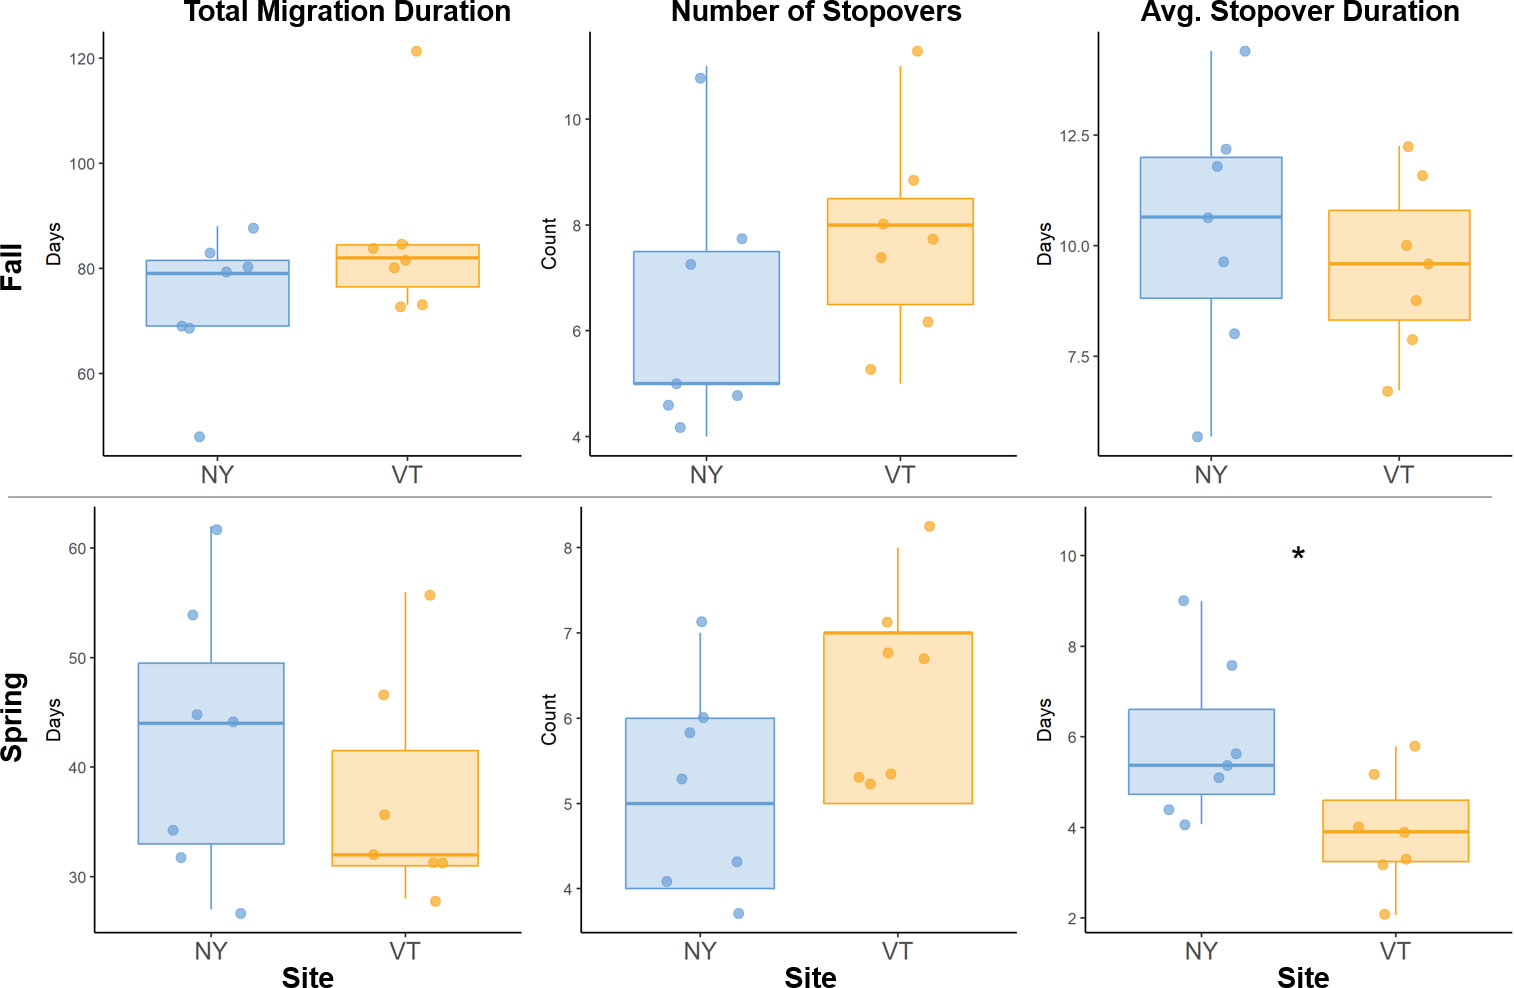
Fig. 5. Site-level differences in Bobolinks migratory performance. Fall migration (top row) and spring migration (bottom row) performance metrics for seven New York (blue) and seven Vermont (orange) Bobolinks, showing total migration duration (left column), number of stopovers (middle column), and average stopover duration (right column). Asterisk indicates significant difference (P < 0.05) for spring average stopover duration only.
Table 1
Table 1. Names and definitions of six migration metrics used in the analysis of migratory timing (top three metrics) and performance (bottom three metrics) of Bobolinks, during both fall and spring migration.
| Metric | Definition | ||||||||
| Departure date | Date left breeding ground (fall) or wintering ground (spring) | ||||||||
| Ocean crossing date | Date initiated western Atlantic (fall) or Caribbean Sea (spring) crossing | ||||||||
| Arrival date | Date arrived at non-breeding ground (fall) or breeding ground (spring) | ||||||||
| Total migration duration | Number of days between departure and arrival | ||||||||
| Number of stopovers | Count of stationary periods during migration | ||||||||
| Avg. stopover duration | Mean duration of individual stopover periods (d) | ||||||||
Table 2
Table 2. Mantel correlation coefficients and associated p-values for spatial relationships between annual cycle stages in Bobolinks (n = 14).
| Comparison | Correlation | p-value | |||||||
| Wintering versus fall ocean | 0.129 | 0.232 | |||||||
| Breeding versus wintering | −0.036 | 0.616 | |||||||
| Breeding versus fall ocean | −0.045 | 0.619 | |||||||
| Breeding versus spring ocean | −0.059 | 0.769 | |||||||
| Fall ocean versus spring ocean | −0.141 | 0.791 | |||||||
| Wintering versus spring ocean | −0.251 | 0.960 | |||||||