





The following is the established format for referencing this article:
Piauwasdy, A., L. R. Halpin, J. Adams, J. Potemra, and K. D. Hyrenbach. 2026. Geolocator devices did not affect chick growth or adult return rates in Wedge-tailed Shearwaters (Ardenna pacifica) despite interannual variation in chick development. Journal of Field Ornithology 97(3):3.ABSTRACT
Although biologging has transformed seabird ecology, bird-borne devices could alter the behaviors being studied, including parental care. We tested for effects of leg-mounted light-level geolocators (< 1% of body mass) on chick growth and adult return rates in Wedge-tailed Shearwaters (‘ua‘u kani, Ardenna pacifica) breeding on O‘ahu, Hawai‘i during two consecutive breeding seasons that coincided with contrasting El Niño Southern Oscillation (ENSO) years. Accounting for hatching phenology, we compared three responses of two tagging groups (tagged and non-tagged controls): (1) chick growth rates (mass, wing chord, 10th primary), (2) chick survival to fledging, and (3) adult return rates in the following breeding season. We found a significant effect of year on overall chick growth patterns, but no effect of tagging or sex-specific impacts. Chick survival did not differ between groups in either year. Regardless of the tagging group, all chicks in 2023 grew wing chords more slowly and reached lower peak body mass compared to chicks in 2022. However, growth rates did not differ between tagging groups within either season. Despite these interannual differences in chick growth, geolocator deployments did not impact breeding performance or adult return rates to the colony. These results emphasize the importance of evaluating device effects to avoid misinterpreting interannual variability as a tagging impact, and reinforce the value of even small-scale comparisons of tagged and non-tagged groups.
RESUMEN
A pesar de que el bioseguimiento (biologging) ha transformado la ecología de las aves marinas, los dispositivos colocados en las aves podrían alterar los comportamientos objeto de estudio, incluido el cuidado parental. Evaluamos los efectos de los geolocalizadores, montados en la pata (< 1 % de la masa corporal), sobre el crecimiento de los polluelos y las tasas de retorno de los adultos en la pardela del Pacífico (ua‘u kani, Ardenna pacifica) en la colonia reproductiva de O‘ahu, Hawái, durante dos temporadas reproductivas consecutivas que coincidieron con años contrastantes del fenómeno El Niño-Oscilación del Sur (ENOS). Considerando la fenología de eclosión, comparamos tres respuestas entre dos grupos de estudio (aves marcadas con geolocalizadores y controles no marcados): 1. Tasas de crecimiento de los polluelos (masa corporal, longitud de la cuerda alar y de la pluma décima primaria). 2. Supervivencia de los polluelos hasta la etapa de volantón. 3. Tasas de retorno de los adultos en la siguiente temporada reproductiva. Encontramos un efecto significativo del año en los patrones generales de crecimiento de los polluelos, pero no se observaron efectos del marcado ni impactos específicos asociados al sexo. La supervivencia de los polluelos no difirió entre los grupos en ninguno de los dos años. Independientemente del grupo marcado, todos los polluelos de 2023 mostraron un crecimiento alar más lento y alcanzaron una masa corporal máxima inferior a la de los de 2022. Sin embargo, las tasas de crecimiento no difirieron entre los grupos de marcado en ninguna de las dos temporadas. A pesar de estas diferencias interanuales en el crecimiento de los polluelos, la colocación de geolocalizadores no afectó el éxito reproductivo ni las tasas de retorno de los adultos a la colonia. Estos resultados enfatizan la importancia de evaluar los efectos de los dispositivos para evitar la malinterpretación de la variabilidad interanual como efecto del marcado y refuerzan el valor de realizar comparaciones, incluso a pequeña escala, entre grupos marcados y no marcados.
INTRODUCTION
Advancements in biologging technology have transformed seabird ecology by enabling researchers to track movements, understand behaviors, and identify important habitats across vast ocean environments (Burger and Shaffer 2008). These tools have increased knowledge of migration (McDuie and Congdon 2016), foraging ecology (Correia et al. 2024), and habitat use (Dunn et al. 2024) at individual and population scales. However, carrying these devices can alter the natural behavior of tagged individuals, potentially biasing interpretation and raising ethical concerns (Paton et al. 2020, Clewley et al. 2021).
Despite the widespread use of biologging devices, relatively few studies investigate their effects as part of tagging studies (Vandenabeele et al. 2012, Geen et al. 2019). Instead, researchers often rely on generalized tag-to-body-mass ratio guidelines (e.g., < 3%–5% of body mass) or assume that impacts documented in one species apply to others (Phillips et al. 2003, Wilson and McMahon 2006, Casper 2009). Yet, device effects can vary substantially among species and study designs. Experimental studies have documented changes in foraging trip duration, adult body condition, and chick provisioning in some seabird species (Paredes et al. 2005, Adams et al. 2009, Heggøy et al. 2015, Schacter and Jones 2017). Both short-term behavioral responses (days to weeks; Chivers et al. 2016, Gillies et al. 2020) and longer-term effects (months to one year; Elliott et al. 2012) have been reported in seabirds. Meta-analyses have highlighted that these impacts depend on species-specific traits (such as flying style and body size), attachment methods, tag size, and deployment duration (Barron et al. 2010, Costantini and Møller 2013, Bodey et al. 2018). However, not all studies have detected negative effects. Some seabird studies have found no detectable effects of device deployment on behavior, apparent survival, or adult return rates in either the short or long term (Carneiro et al. 2016, Kürten et al. 2019, Nicoll et al. 2022). These findings highlight the need for species-specific and context-dependent assessments of device effects at multiple temporal scales.
Environmental variability may further complicate detection and interpretation of these impacts because breeding performance in seabirds is strongly influenced by oceanographic conditions and prey availability, which vary from year to year. Device effects could therefore be masked by, or interact with, background interannual variability in breeding performance. Distinguishing device effects from environmental variation requires comparisons across more than one breeding season.
In this experiment, we tested whether deployment of light-level geolocators affects breeding performance in Wedge-tailed Shearwaters (ʻuaʻu kani, Ardenna pacifica) across two breeding seasons (2022 and 2023). Wedge-tailed Shearwaters are a medium-sized tropical shearwater that dives to an average depth of 4 m and can reach depths exceeding 20 m (Hyrenbach et al. 2014, Adams et al. 2020). Geolocators are small archival data loggers (6–19 mm, 0.4–3.0 g) that can be mounted to leg bands. Previous studies of tarsal-mounted geolocators in this species reported no evidence of nest abandonment or reduced fledging mass (Catry et al. 2009, McDuie and Congdon 2016), but these studies did not evaluate device effects across multiple years.
Environmental conditions during the breeding season can influence chick growth and provisioning rates in seabirds. Because chick-rearing Wedge-tailed Shearwaters lower provisioning rates and feed smaller meal sizes during periods of warmer sea-surface temperature (Peck et al. 2004), chick development may be sensitive to interannual variability in ocean conditions. To account for this variability, we compared chick growth and adult return rates between geolocator-tagged and non-tagged adults during two consecutive breeding seasons that differed in large-scale oceanographic conditions (2022 and 2023).
Sex-specific differences in chick-provisioning behavior have been documented in this species; females have greater foraging ranges (Catry et al. 2009) and longer trip durations than males, resulting in males feeding chicks more frequently (Peck and Congdon 2006). Although Wedge-tailed Shearwater males have a greater bill depth, there is no evidence of strong sexual dimorphism in this species (Bull et al. 2005). Sex differences in foraging behavior of monomorphic species can arise because of varying energetic or nutritional needs between the sexes, influenced by factors like the costs of egg production (Monaghan et al. 1998) or unequal incubation shifts (Hatch 1990, Creelman and Storey 1991). Sex differences in parental investment or foraging behavior could mediate responses to device deployment (Ackerman et al. 2004). Therefore, we also evaluated whether device effects differed between males and females.
The goal of this study was to test whether deployment of geolocators (< 1% body mass) affected breeding success and subsequent return rates in adult Wedge-tailed Shearwaters. Specifically, we tested whether (1) chicks provisioned by tagged adults grew at the same rate as chicks provisioned by non-tagged but banded adults, (2) geolocator deployment affects adult return rates the following breeding season, and (3) sex-specific device effects occur. If tagging imposed energetic costs on adults, we predicted that chicks of tagged adults would show lower growth and survivorship compared to chicks of non-tagged adults, and that return rates the following year would be lower for tagged adults than for non-tagged adults.
METHODS
Study site and device attachment
We studied Wedge-tailed Shearwaters breeding at the Freeman Seabird Preserve (21°15.36' N, 157°47.51' W) on the island of Oʻahu, Hawaiʻi during the 2022 and 2023 breeding seasons. Wedge-tailed Shearwaters nest in this 0.5 hectare urban colony between March and November in artificial rock and brick structures and in ceramic nest modules, which facilitate capture by hand through their burrow entrances. In this colony, multiple pairs often share large rock formations for nesting, resulting in the intermingling of chicks. To ensure we followed the same chicks throughout the breeding season, we only selected isolated burrows with a single entrance.
We deployed Lotek MK4093 (Lotek Wireless, Inc.) light-level geolocators (25 in 2022 and 30 in 2023, hereafter “tags”) on adults provisioning chicks during the early chick rearing period in August, and we retrieved them upon return to the colony in April the following breeding season. Tags were attached with a single nylon cable tie to a metal incoloy band on the left tarsus (Fig. 1). The total attachment mass was 2.6 g, equivalent to < 1 % of adult body mass (mean mass ± SD: 393 ± 30.7 g; n = 113; Whittow 2020). The dimensions of the tags, excluding the communication pins, were 15 × 10 × 6 mm (L × W × D). The incoloy band was flattened into a “D” shape to prevent the tag from rotating toward the interior side of the leg. We deployed tags during the brooding period (i.e., shortly after chicks hatched) because nest abandonment is more likely to occur during incubation (Sun et al. 2020), and because adults are most likely to be present in the burrow after hatching. Only one adult from each pair was tagged in a single year to reduce any potential effects on chicks. Mean handling time ± SD during deployment was 7.58 ± 1.92 min for the instrumented group (banding and tagging) and 5.33 ± 1.88 min for the control (banding only) group.
Breeding success
We assessed the breeding success of two groups: tagged adults (banded and tagged) and non-tagged adults (banded only). To minimize biases associated with individual colony attendance or provisioning rates, we alternated treatment assignment during tag deployment in early chick-rearing, assigning every other bird to the tagged or non-tagged group. We also restricted sampling to burrows with a consistent history of previous occupancy to reduce potential biases related to site quality or breeding experience. We evaluated breeding success during the 2022 and 2023 chick-provisioning season using two criteria (1) the growth and development of chicks based on their body mass (g), unflattened wing chord (mm), and 10th primary (P10) length (mm), and (2) chick survival to fledging.
Throughout two chick rearing seasons (2022 and 2023), we visually inspected burrows, weighed chick body mass (± 1.0 g, digital hanging scale, American Weigh Scale SR-1, Cummings, GA), and measured chick wing chord and 10th primary feather (P10) lengths (± 1.0 mm) weekly during the evening (4:00 to 7:00 PM local time), starting one week after tag deployment (20–21 August 2022 and 18–20 August 2023) and until the third week of November, when the chicks reached fledging stage. A chick was presumed to have fledged when it was ≥ 100 d old (mean fledging age in Hawaiʻi [Pettit et al. 1984]) and had departed from its burrow.
Adult return rates
We also compared adult return rates to the colony in the following breeding seasons (2023 and 2024), as confirmed by recapture. We searched for returning birds twice weekly prior to the pre-laying exodus in April each year. Searches involved checking every burrow and adjacent areas within the colony to maximize chances of recapture. Cumulative search effort totaled 30 h in 2023 and 35.25 h in 2024 (Appendix 1 Fig. S1).
To determine the sex of birds and explore sex-specific device effects, we sampled a drop of blood from the foot webbing vein of handled adults in both comparison groups during recaptures the following breeding season. Blood was preserved on Flinders Technology Associate (FTA) cards (Whatman Corporation, Kent, UK.) and molecular determination of sex was carried out by the Pacific Center for Molecular Biodiversity, Bishop Museum, Honolulu, Hawaiʻi.
Chick growth rates
For each fledged chick, we fit linear regressions (predictor: chick age) to three response variables: mass, wing chord length, and P10 length. To confirm that we used the linear portion of growth curves, we calculated the R² values of the linear regressions and tested the residuals of each model for normality. The significant best-fit slopes were used to estimate daily growth rates for mass (g d-1), wing chord (mm d-1), and P10 (mm d-1). Although one chick for wing chord growth, three chicks for P10 growth, and five chicks for mass gain had abnormal residuals, these individuals were retained in the analysis because excluding them did not affect subsequent test results.
Because procellariiform chicks are irregularly fed large food loads and lose mass prior to fledging, we evaluated the linear growth portion between 10% and 90% of the peak mass each chick attained (Richdale 1945, Huin and Prince 2000). Because of weekly oscillations in body mass, 22% of chicks (pooled across both years) reached 90% of their peak mass on two separate occasions. For these individuals, we fit a separate linear regression to each 90% peak mass, resulting in two slope estimates per chick. The second (later in time) slope was significantly smaller than the first in 2023 (Paired t-test: n = 15, p < 0.001), but not in 2022 (n = 7, p = 0.055), indicating a systematic underestimate of the growth rate when the second slope was used. Thus, for the chicks reaching their 90% peak mass twice, we used the first slope to estimate daily mass growth rate. Two chicks were excluded from the mass analysis: one in 2022 because of a non-significant regression slope, and another in 2023 because it only had two mass measurements due to its inaccessible nest.
Statistical and power analysis
To test the effects of tagging and interannual variability on chick growth, we first used a permutational multivariate analysis of variance (PERMANOVA) to evaluate the influence of tagging (tagged versus non-tagged), year (2022 versus 2023), sex (male versus female), and all interactions on the combined variation in three scaled chick growth metrics (mass, wing chord, P10). This multivariate approach accounted for potential covariation among growth metrics and provided an overall test of tagging effects before examining individual metrics. We tested for homogeneity of multivariate dispersions between groups (tagged versus non-tagged) using a permutation test (betadisper in the R “vegan” package) to assess whether differences in within-group variance could influence PERMANOVA results. To visualize individual variability and group-level differences, we performed a principal components analysis (PCA) on the scaled growth rates using a two-dimensional solution. We then used separate ANOVAs for each growth metric to identify which biometric contributed to the observed multivariate pattern. These models tested the fixed effects of tagging, year, and sex and their two-way interactions. We interpreted univariate results in the context of multivariate findings, using them to characterize variation within specific growth metrics rather than as independent tests of overall device effects. We tested for interannual differences in peak growth metrics (including peak mass and peak wing chord), the age at which peak values were reached, and the age at last feeding (inferred from the onset of mass loss) using Welch’s t-tests when assumptions of normality were met and Mann-Whitney U tests when normality assumptions were not met. We tested the sex-specific proportion of returning adults in each group each year using Chi-square tests.
Finally, we conducted a power analysis using the R “pwrss” package to determine the ability to detect potential device effects on the three growth rates based on ANOVA comparisons with a sample size of 100 birds and varying effect sizes (η²; Bulus 2023). We used the function “DurgaDiff” in R “durga” package to calculate mean differences and bootstrapped confidence intervals for each growth rate (Khan and McLean 2024). All statistical analyses were completed using R version 4.3.3, and significance was assessed at alpha = 0.05.
Estimates of hatch date
Because hatching phenology at the Freeman Seabird Preserve varies from year to year, with earlier hatching leading to a higher peak mass (Hyrenbach 2011), we included hatching date as a covariate in our analysis of growth rates. To assess if the timing of hatching influenced chick growth rates, we estimated median hatch dates (MHD) and hatch date intervals (HDI) for each chick. Because no exact hatch dates were recorded through direct observations of pipping eggs, we define the MHD as the hatch day of year (DOY):

|
(1) |
Although nest checks occurred weekly (7-d intervals), in some instances we could not confirm if a chick had hatched that week because of a protective adult. To account for these cases, we calculated a hatch date interval, defined as the number of days between the date the chick was first seen and the date the egg was last seen. We explored the influence of the HDI on MHD each year separately, using two Spearman’s rank correlations. Then, we used general linear models to relate each growth rate criterion (mass, wing chord, P10) to three predictors: a fixed-effect treatment factor (tagged versus non-tagged), the MHD covariate, and the HDI covariate. Finally, we compared the MHD and the HDI between treatment groups (tagged versus non-tagged) and years (2022 versus 2023) using non-parametric Mann-Whitney U tests.
RESULTS
Chick survival to fledging did not differ between tagged and non-tagged groups in either breeding season. In 2022 and 2023, the proportion of chicks that fledged was 92% and 100%, respectively, for both groups (Table 1).
Overall, we recaptured 97 of 104 adults: 52 of 55 (95%) tagged individuals and 45 of 49 (92%) non-tagged individuals (Table 1). Return rates did not differ between tagged and non-tagged groups in either year (2023: χ² = 0.01, df = 1, p = 0.92; 2024: χ² = 0.002, df = 1, p = 0.96), nor did they differ between sexes during either year (2023: χ² = 0.01, df = 1, p = 0.90; 2024: χ² = 0.03, df = 1, p = 0.85). Upon tag retrieval, one adult in 2024 had a small leg abrasion likely caused by the band and attached geolocator. No other injuries were observed, and no leg bands needed replacement upon recapture.
Duration of tag deployment was 236 ± 5 (mean ± SD) d when both years were combined (n = 51). This estimate excludes one individual of unknown sex tagged in August 2022 and recaptured in August 2023, with a long deployment of 364 d. Recapture success was similar between tagged and non-tagged groups each year, with the maximum number of study birds recaptured after 25 h of cumulative survey effort in 2023 and 27 h in 2024 (Appendix 1 Fig. S1).
Chick growth
PERMANOVA results revealed a significant effect of year on overall chick growth patterns (F1,81 = 7.83, R² = 0.08, p = 0.001), indicating that chick development differed between the 2022 and 2023 breeding seasons. There was no significant effect of tagging (F1,81 = 0.96, R² = 0.01, p = 0.418) or sex (F1,81 = 0.25, R² = 0.003, p = 0.858). No significant interactions involving tagging were detected, including tagging × year (F1,81 = 1.88, R² = 0.019, p = 0.150) or the three-way interaction (F1,81 = 1.55, R² = 0.016, p = 0.204). However, there was a significant year × sex interaction (F1,81 = 3.52, R² = 0.036, p = 0.011), indicating that the effect of sex on multivariate growth responses differed between the two breeding years. We visualized these patterns using a two-dimensional PCA that explained 75.9% of the observed variance in chick growth rates and showed separation by year, with substantial overlap between the tagged and non-tagged groups within each year (Fig. 2). Multivariate dispersion did not differ between tagged and non-tagged birds (F1,87 = 1.29, p = 0.25).
To explore individual growth metrics, we used univariate ANOVAs for each response variable. We found no effects of tagging (F1,81 = 0.101, p = 0.75), year (F1,81 = 3.269, p = 0.07), or sex (F1,81 = 0.022, p = 0.88) on the rates of daily mass gain in chicks (Fig. 3a). There was no interaction between tagging and sex (F1,81 = 0.054, p = 0.82), but there were significant interactions between tagging and year (F1,81 = 4.409, p = 0.04) and sex and year (F1,81 = 4.363, p = 0.04). When all chicks were combined, peak masses were 6.25% lower in 2023 than in 2022 (Welch’s t-test, t89.8 = 3.49, p < 0.001). Although there was no significant difference in the age chicks reached the peak mass between years (Mann-Whitney, U = 1480, p = 0.10), the age of the last feeding (inferred using the last gained mass during weekly monitoring) was greater in 2023 than in 2022 (Mann-Whitney, U = 775, p = 0.001).
Although there was no effect of tagging on chick wing chord growth rate (F1,83 = 3.751, p = 0.06), there was a significant effect of year (F1,83 = 29.741, p < 0.001). In 2023, the mean wing chord growth rate was 6.48% lower for the tagged group and 7.97% lower for the non-tagged group, compared to 2022 (Fig. 3b). There were no significant interactions between tagging and year (F1,83 = 0.373, p = 0.543), tagging and sex (F1,83 = 3.793, p = 0.055), and year and sex (F1,83 = 2.709, p = 0.104), as evidenced by the pairwise comparisons of the mean differences across groups and years (Table 2). Furthermore, maximum wing chord length was not different between years (Mann-Whitney, U = 1295, p = 0.72), nor was the age of the chicks when they reached maximum wing chord length (Mann-Whitney, U = 1348, p = 0.46).
The chick P10 growth rates varied the least of any measured variables between tagging groups and between years. There was no effect of tagging (F1,83 = 0.000, p = 0.984), no effect of year (F1,83 = 0.040, p = 0.843), and no effect of sex (F1,83 = 0.872, p = 0.353) on the growth rates of P10 (Fig. 3c). Although there was no significant interaction of tagging and year (F1,83 = 1.653, p = 0.202), or tagging and sex (F1,83 = 1.802, p = 0.183), there was a significant interaction between year and sex (F1,83 = 4.259, p = 0.04).
Power analysis indicated 80% power to detect small (η² ≥ 0.075) effects in the ANOVA tests of chick growth rates (Appendix 1 Fig. S2). The observed effect size of tagging was small for wing chord growth (η² = 0.043) and very small for mass (η² = 0.001) and P10 growth (η² < 0.001). If geolocator device effects were present, they were likely very small (η² < 0.02).
Effect of hatch date on chick growth
In 2022, the MHD was DOY 217.5 (IQR: 7.5 d, DOY range: 212–230, i.e., 31 July–8 August), whereas in 2023, the MHD was DOY 219.5, with no variation in the interquartile range (IQR: 0 d, DOY range: 212.5–227, i.e., 31 July–15 August). Despite the greater hatch synchrony in 2023, chicks hatched significantly later than in 2022 (Mann-Whitney, U = 795, p < 0.001). This shift in MHD may be linked to differences in HDI (the number of days between the egg last being seen and the chick first observed), which also varied significantly between years (Mann-Whitney, U = 1794, p < 0.001). HDI was more variable in 2022 (median: 8 d, IQR: 1 day, range: 7–15 d) than in 2023 (median: 7 d, IQR: 0 d, range: 6–8 d).
MHD and HDI were significantly correlated in both years (Spearman’s rank, 2023: ρ = 0.653, n = 54, p < 0.001; 2022: ρ = -0.745, n = 46, p < 0.001), indicating that our inability to detect inaccessible chicks during nest checks (HDI interval of 14–15 d) influenced the estimates of hatching dates. However, variation in MHD and HDI did not influence the chick growth rates. We found no significant difference in MHD between the tagged and non-tagged groups in either 2023 (Mann-Whitney, U = 376.5, p = 0.75) or 2022 (Mann-Whitney, U = 276.5, p = 0.78). Similarly, there was no significant difference in HDI between the two groups in 2023 (Mann-Whitney, U = 349.5, p = 0.79) or 2022 (Mann-Whitney, U = 270, p = 0.90). Furthermore, MHD and HDI did not significantly explain variation in growth rates for mass, wing chord, or P10 during either year (Table 3).
DISCUSSION
We found no adverse effect of geolocator deployment on chick growth or survival to fledging in Wedge-tailed Shearwaters during either breeding season, even after accounting for hatching phenology. Similarly, apparent overwinter survival, a metric that includes actual survivorship and breeding propensity, did not differ between groups, as tagged and non-tagged adults returned at similar rates the following year. Although we cannot differentiate between skipping breeding and mortality, the high apparent overwinter survival of tropical shearwaters suggests that skipping breeding is the most likely reason for failure to return to the breeding colony the following year (Vanderwerf et al. 2015, Precheur et al. 2016). The overall return rate for Wedge-tailed Shearwaters in this study (0.93) was similar to the apparent annual survival estimated for breeding Flesh-footed Shearwaters (Ardenna carneipes, 0.94 ± 0.087 SE; Barbraud et al. 2014), indicating that return rates at our study colony are comparable to survival rates for similar shearwaters. The PERMANOVA revealed a significant effect of year, but not tagging, on chick growth patterns. PCA visualization showed separation of chicks by year, while the tagged and non-tagged groups largely overlapped within each year. Follow-up ANOVAs were consistent with this overall pattern: no individual growth metric differed between tagged and non-tagged groups within each year. These patterns indicated that, in our study, interannual variability had a stronger influence on chick development than geolocator deployment. The power analysis further indicated that any undetected device effects would have been very small in magnitude and unlikely to be biologically meaningful. Overall, geolocator deployment lasting six months to one year, attached via leg bands and weighing less than 1% of body mass, did not negatively affect chick growth, fledging success, or adult return rates in Wedge-tailed Shearwaters at the Freeman Seabird Preserve, Oʻahu.
The 2022 chick-provisioning season occurred during the cool phase of the El Niño Southern Oscillation (ENSO), according to the Multivariate El Niño Index (MEI range: -1.8 to -1.3), whereas the 2023 season experienced contrasting conditions during the warm ENSO phase (MEI range: +0.5 to +1.1, Appendix 1 Fig. S3). Positive MEI values during the chick-provisioning period (August to November) in 2023 indicated that the central Pacific experienced a weak to moderate warm phase. Annual conditions appeared to impact all chicks regardless of tagging group, as they attained lower peak masses despite continued feeding at older ages during the warmer El Niño year. This pattern is consistent with previous studies of Wedge-tailed Shearwaters, which found reduced provisioning rates and smaller meal sizes during periods of elevated sea surface temperature (Peck et al. 2004), and with observations of lower peak chick masses during El Niño years in this study colony (Hyrenbach 2011). Although previous studies have suggested that impacts from device deployment may become more pronounced under unfavorable environmental conditions (Igual et al. 2005, Chivers et al. 2016), we did not detect a significant device effect on chick growth or adult return rates.
Although chicks hatched later in 2023, we observed lower wing chord growth rates in both groups, despite no significant interannual differences in peak wing chord length and age of peak wing length. We suggest that wing growth was sensitive to interannual oceanographic variability, even though chicks ultimately attained similar wing lengths by fledging in both years. Because body mass can be highly variable in procellariiform chicks due to irregular feeding patterns, wing chord may offer a more sensitive metric for detecting changes in chick development. Wing chord length could therefore serve as a more reliable metric for detecting potential device effects and interannual variation, particularly when frequent mass measurements are not feasible.
Growth rates of P10 varied the least across comparison groups and years, despite slower wing chord growth during the El Niño year. This result indicates a degree of developmental plasticity in Wedge-tailed Shearwater chick growth under less desirable conditions. Preferential feather growth enables chicks to achieve flight and fledge by the end of the rearing season, which is a requirement for survival. Differential growth in response to food scarcity has been observed in Caspian Terns (Hydroprogne caspia) and Atlantic Puffins (Fratercula arctica), where feather growth is maintained over other structural growth parameters, such as wing length and tarsus, under reduced food availability (Øyan and Anker-Nilssen 1996, Lyons and Roby 2011).
Although we observed a year × sex interaction in multivariate growth patterns and in univariate models for mass gain and P10 growth, there was no effect of sex or tagging × sex interaction in the PERMANOVA. Chick growth did not differ between tagged and non-tagged males and females within either year. Despite their monomorphism, male and female Wedge-tailed Shearwaters have been observed to segregate at sea during foraging trips, leading to males provisioning chicks at higher rates (Peck and Congdon 2006), which may contribute to sex-specific responses to interannual variability. In our study, however, any differences were independent of tagging treatment, indicating that although male and female provisioning behavior may respond differently to annual ocean conditions, geolocator deployment did not differentially affect parental performance by sex. In other seabirds, sex-specific device effects have been documented. Ackerman et al. (2004) found reduced chick growth and fledging success when adult male Cassin’s Auklets (Ptychoramphus aleuticus) were tagged with Very High Frequency transmitters compared to females. Schacter and Jones (2017) found reduced fledging success among chicks when adult male Parakeet Auklets (Aethia psittacula) were tagged with geolocators. Unlike our results for Wedge-tailed Shearwaters, these studies indicated that male-biased parental care may contribute to a sex-specific response among chicks to device deployments on their provisioning parents.
Because only one parent in each breeding pair was tagged, any reduction in provisioning by the tagged adult could have been offset by compensatory effort from the non-tagged partner. This behavior has been observed in other seabird species (e.g., Paredes et al. 2005, Navarro and González-Solís 2007) and could buffer chicks from short-term changes in parental performance. In our study, however, tagging did not result in differences in chick growth within a breeding season, nor in adult return rates the following year, indicating that geolocator deployment did not produce measurable breeding consequences for either the tagged individual or its partner.
Responses to device deployment likely vary among seabird species and different tagging scenarios. The tags we used were small (< 1% of body mass), and Wedge-tailed Shearwaters, being for the most part near surface feeders (Adams et al. 2020) with low wing-loading, primarily glide with occasional flapping (Spear and Ainley 1997). In contrast, seabirds with deep-diving habits and high wing-loading, such as deep-diving shearwaters and alcids, may be more susceptible to increased drag and energetic costs associated with tagging (e.g., Crested Auklets, Aethia cristatella; Robinson and Jones 2014). More intensive tagging scenarios, including heavier or bulkier devices, back-mounted attachments, or tagging both members of a breeding pair, could plausibly produce different outcomes in this species.
Our study evaluated geolocator deployment to assess potential impacts on a small breeding colony and to identify possible biases in the resulting tracking data. This comparison underscores the importance of experimental studies as the impacts of tagging can vary based on species, device type, and the year of study. Despite the challenges posed by site accessibility and logistical constraints, incorporating evaluation of device effects strengthens both the interpretation of resulting data and the ethical standards of biologging research. Our findings illustrate how interannual variation in chick growth can occur independently of tagging. Even relatively small-scale comparisons, such as evaluating a single metric because of logistical constraints, can still provide context for interpreting results and help prevent interannual variability from being misattributed to tagging impacts. As biologging expands to smaller species and longer deployments, careful consideration of species ecology, including sex-specific differences (e.g., morphometrics, incubation, ranging behavior), attachment method, and interannual variability in environmental conditions (e.g., prey availability, diving effort, wind speeds), will remain essential. Continued vigilance in assessing device effects can ensure that biologging continues to advance ecological understanding and conservation science while minimizing unintended impacts.
RESPONSES TO THIS ARTICLE
Responses to this article are invited. If accepted for publication, your response will be hyperlinked to the article. To submit a response, follow this link. To read responses already accepted, follow this link.
AUTHOR CONTRIBUTIONS
Conceptualization: AP, KDH, LRH, JA, JP; Data curation: AP, KDH; Analysis: AP, KDH; Funding acquisition: KDH, AP; Visualization: AP, KDH, LRH, JA, JP; Writing – original draft: AP; Review and Editing: AP, KDH, LRH, JA, JP
ACKNOWLEDGMENTS
We thank the Pacific Center for Molecular Biodiversity at the Bishop Museum for assistance with genetic analysis of sex, and Brianna Law for assistance in the field. We are grateful to the Hawaiʻi Audubon Society and the many volunteers at the Freeman Seabird Preserve, who dedicate time restoring the preserve and who contributed to this study. We thank Susan De La Cruz at U.S. Geological Survey (USGS) and the reviewers for valuable comments that improved the manuscript. JA was supported in part by the USGS Ecosystems Mission Area. Any use of trade, firm, or product names is for descriptive purposes only and does not imply endorsement by the U.S. Government. Fieldwork was conducted with USGS Bird Banding Laboratory permit 23317.
DATA AVAILABILITY
Data are available at https://doi.org/10.6084/m9.figshare.32692257.
LITERATURE CITED
Ackerman, J. T., J. Adams, J. Y. Takekawa, H. R. Carter, D. L. Whitworth, S. H. Newman, R. T. Golightly, and D. L. Orthmeyer. 2004. Effects of radiotransmitters on the reproductive performance of Cassin’s auklets. Wildlife Society Bulletin 32:1229-1241. https://doi.org/10.2193/0091-7648(2004)032[1229:EOROTR]2.0.CO;2
Adams, J., J. J. Felis, and M. F. Czapanskiy. 2020. Habitat affinities and at-sea ranging behaviors among main Hawaiian island seabirds: breeding seabird telemetry, 2013-2016. U.S. Department of the Interior, Bureau of Ocean Energy Management, Pacific OCS Region. Camarillo, California, USA.
Adams, J., D. Scott, S. McKechnie, G. Blackwell, S. A. Shaffer, H. Moller. 2009. Effects of geolocation archival tags on reproduction and adult body mass of sooty shearwaters (Puffinus griseus). New Zealand Journal of Zoology 36(3):355-366. https://doi.org/10.1080/03014220909510160
Barbraud, C. A., A. Booth, G. A. Taylor, and S. M. Waugh. 2014. Survivorship in Flesh-footed Shearwater Puffinus Carneipes at two sites in northern New Zealand. Marine Ornithology 42(2):91-97. https://doi.org/10.5038/2074-1235.42.2.1074
Barron, D. G., J. D. Brawn, and P. J. Weatherhead. 2010. Meta-analysis of transmitter effects on avian behaviour and ecology. Methods in Ecology and Evolution 1(2):180-187. https://doi.org/10.1111/j.2041-210X.2010.00013.x
Bodey, T. W., I. R. Cleasby, F. Bell, N. Parr, A. Schultz, S. C. Votier, and S. Bearhop. 2018. A phylogenetically controlled meta-analysis of biologging device effects on birds: deleterious effects and a call for more standardized reporting of study data. Methods in Ecology and Evolution 9(4):946-955. https://doi.org/10.1111/2041-210X.12934
Bull, L. S., B. D. Bell, and S. Pledger. 2005. Patterns of size variation in the Shearwater genus Puffinus. Marine Ornithology 33:27-39. https://doi.org/10.5038/2074-1235.33.1.638
Bulus M., and S. Jentschke. 2023. pwrss: Statistical Power and Sample Size Calculation Tools. R package version 0.3.1. https://doi.org/10.32614/CRAN.package.pwrss
Burger A. E., and S. A. Shaffer. 2008. Application of tracking and data-logging technology in research and conservation of seabirds. Auk 125(2):253-264. https://doi.org/10.1525/auk.2008.1408
Carneiro, A. P. B., A. Manica, T. A. Clay, J. R. D. Silk, M. King, and R. A. Phillips. 2016. Consistency in migration strategies and habitat preferences of Brown Skuas over two winters, a decade apart. Marine Ecology Progress Series 553:267-281. https://doi.org/10.3354/meps11781
Casper, R. M. 2009. Guidelines for the instrumentation of wild birds and mammals. Animal Behaviour 78(6):1477-1483. https://doi.org/10.1016/j.anbehav.2009.09.023
Catry, T., J. Ramos, M. Le Corre, and R. Phillips. 2009. Movements, at-sea distribution and behaviour of a tropical pelagic seabird: the Wedge-tailed Shearwater in the western Indian Ocean. Marine Ecology Progress Series 391:231-242. https://doi.org/10.3354/meps07717
Chivers, L. S., S. A. Hatch, and K. H. Elliott. 2016. Accelerometry reveals an impact of short-term tagging on seabird activity budgets. Condor 118(1):159-168. https://doi.org/10.1650/CONDOR-15-66.1
Clewley, G. D., A. S. C. P. Cook, J. G. Davies, E. M. Humphreys, N. J. O’Hanlon, E. Weston, T. Boulinier, and A. Ponchon. 2021. Acute impacts from Teflon harnesses used to fit biologging devices to Black-legged Kittiwakes Rissa tridactyla. Ringing and Migration 36(2):69-77. https://doi.org/10.1080/03078698.2022.2151065
Cohen, J. 1992. Statistical power analysis. Current Directions in Psychological Science 1(3):98-101. https://doi.org/10.1111/1467-8721.ep10768783
Correia, E., M. Beal, N. Gomes, N. Diop, F. Wambar, M. P. Dias, A. Hernandez-Rios, and T. Catry. 2024. Foraging movements and important sites for conservation of the West African Crested Tern Thalasseus albididorsalis breeding in Guinea-Bissau. Marine Biology 171(1):15. https://doi.org/10.1007/s00227-023-04338-6
Costantini, D., and A. P. Møller. 2013. A meta-analysis of the effects of geolocator application on birds. Current Zoology 59(6):697-706. https://doi.org/10.1093/czoolo/59.6.697
Creelman E., and A. E. Storey. 1991. Sex differences in reproductive behavior of Atlantic Puffins. Condor 93(2):390-398. https://doi.org/10.2307/1368955
Dunn, R. E., R. Freeman, M. A. Nicoll, J. Ramsden, A. M. Trevail, H. Wood, and S. C. Votier. 2024. From route to dive: multi-scale habitat selection in a foraging tropical seabird. Marine Biology 171(6):124. https://doi.org/10.1007/s00227-024-04445-y
Elliott, K. H., L. McFarlane-Tranquilla, C. M. Burke, A. Hedd, W. A. Montevecchi, and W. G. Anderson. 2012. Year-long deployments of small geolocators increase corticosterone levels in murres. Marine Ecology Progress Series 466:1-7. https://doi.org/10.3354/meps09975
Geen, G. R., R. A. Robinson, and S. R. Baillie. 2019. Effects of tracking devices on individual birds - a review of the evidence. Journal of Avian Biology 50(2):1-13. https://doi.org/10.1111/jav.01823
Gillies, N., A. L. Fayet, O. Padget, M Syposz, J. Wynn, S. Bond, J. Evry, H. Kirk, A. Shoji, B. Dean, R. Freeman, and T. Guilford. 2020. Short-term behavioural impact contrasts with long-term fitness consequences of biologging in a long-lived seabird. Scientific Reports 10(1):15056. https://doi.org/10.1038/s41598-020-72199-w
Hatch, S. A. 1990. Incubation rhythm in the Fulmar Fulmarus glacialis: annual variation and sex roles. Ibis 132(4):515-524. https://doi.org/10.1111/j.1474-919X.1990.tb00275.x
Heggøy, O., S. Christensen-Dalsgaard, P. Ranke, O. Chastel, and C. Bech. 2015. GPS-loggers influence behaviour and physiology in the Black-legged Kittiwake Rissa tridactyla. Marine Ecology Progress Series 521:237-248. https://doi.org/10.3354/meps11140
Huin, N., and P. A. Prince. 2000. Chick growth in albatrosses: curve fitting with a twist. Journal of Avian Biology 31(3):418-425. https://doi.org/10.1034/j.1600-048X.2000.310318.x
Hyrenbach, K. D. 2011. Tale of two years: monitoring Wedge-tailed Shearwaters at Freeman Seabird Preserve in Black Point, Oʻahu. ʻElepaio 71(3):17-20.
Hyrenbach, K. D., J. S. Gleichman, and N. J. Karnovsky. 2014. Diving behavior of Wedge-tailed Shearwaters rearing chicks on Lehua islet. ʻElepaio 74:1-3.
Igual, J. M., M. G. Forero, G. Tavecchia, J. González-Solis, A. Martínez-Abraín, K. A. Hobson, X. Ruiz, and D. Oro. 2005. Short-term effects of data-loggers on Cory’s shearwater (Calonectris diomedea). Marine Biology 146(3):619-624. https://doi.org/10.1007/s00227-004-1461-0
Khan, M. K., and D. J. McLean. 2024. Durga: an R package for effect size estimation and visualization. Journal of Evolutionary Biology 37(8):986-993. https://doi.org/10.1093/jeb/voae073
Kürten, N., O. Vedder, J. González-Solís, H. Schmaljohann, and S. Bouwhuis. 2019. No detectable effect of light-level geolocators on the behaviour and fitness of a long-distance migratory seabird. Journal of Ornithology 160(4):1087-1095. https://doi.org/10.1007/s10336-019-01686-3
Lyons, D. E., and D. D. Roby. 2011. Validating growth and development of a seabird as an indicator of food availability: captive-reared Caspian Tern chicks fed ad libitum and restricted diets: tern chick growth and food availability. Journal of Field Ornithology 82(1):88-100. https://doi.org/10.1111/j.1557-9263.2010.00311.x
McDuie, F., and B. C. Congdon. 2016. Trans-equatorial migration and non-breeding habitat of tropical shearwaters: implications for modelling pelagic important bird areas. Marine Ecology Progress Series 550:219-234. https://doi.org/10.3354/meps11713
Monaghan, P., R. G. Nager, and D. C. Houston. 1998. The price of eggs: increased investment in egg production reduces the offspring rearing capacity of parents. Proceedings of the Royal Society B: Biological Sciences 265(1407):1731-1735. https://doi.org/10.1098/rspb.1998.0495
Navarro, J., and J. González-Solís. 2007. Experimental increase of flying costs in a pelagic seabird: effects on foraging strategies, nutritional state and chick condition. Oecologia 151:150-160. https://doi.org/10.1007/s00442-006-0559-0
Nicoll, M. A. C., N. C. Cole, C. Horswill, C. G. Jones, N. Ratcliffe, K. Ruhomaun, V. Tatayah, and K. Norris. 2022. No detectable effect of geolocator deployment on the short‐ or long‐term apparent survival of a tropical seabird. Ibis 164(4):1201-1212. https://doi.org/10.1111/ibi.13094
Øyan, H. S., and T. Anker-Nilssen. 1996. Allocation of growth in food-stressed Atlantic Puffin chicks. Auk 113(4):830-841. https://doi.org/10.2307/4088861
Paredes, R., I. L. Jones, and D. J. Boness. 2005. Reduced parental care, compensatory behaviour and reproductive costs of thick-billed murres equipped with data loggers. Animal Behaviour 69(1):197-208. https://doi.org/10.1016/j.anbehav.2003.12.029
Paton, P. W. C., P. H. Loring, G. D. Cormons, K. D. Meyer, S. Williams, and L. J. Welch. 2020. Fate of Common (Sterna hirundo) and Roseate Terns (S. dougallii) with satellite transmitters attached with backpack harnesses. Waterbirds 43(3-4):342-347. https://doi.org/10.1675/063.043.0315
Peck, D. R., and B. C. Congdon. 2006. Sex-specific chick provisioning and diving behaviour in the Wedge-tailed Shearwater Puffinus pacificus. Journal of Avian Biology 37(3):245-251. https://doi.org/10.1111/j.2006.0908-8857.03558.x
Peck, D. R., B. V. Smithers, A. K. Krockenberger, and B. C. Congdon. 2004. Sea surface temperature constrains Wedge-tailed Shearwater foraging success within breeding seasons. Marine Ecology Progress Series 281:259-266. https://doi.org/10.3354/meps281259
Pettit, T. N., G. V. Byrd, G. C. Whittow, and M. P. Seki. 1984. Growth of the Wedge-tailed Shearwater in the Hawaiian islands. Auk 101(1):103-109. https://doi.org/10.1093/auk/101.1.103
Phillips, R. A., J. C. Xavier, and J. P. Croxall. 2003. Effects of satellite transmitters on albatrosses and petrels. Auk 120(4):1082-1090. https://doi.org/10.1093/auk/120.4.1082
Precheur, C., C. Barbraud, F. Martail, M. Mian, J.-C. Nicolas, R. Brithmer, D. Belfan, B. Conde, and V. Bretagnolle. 2016. Some like it hot: effect of environment on population dynamics of a small tropical seabird in the Caribbean region. Ecosphere 7(10):e01461. https://doi.org/10.1002/ecs2.1461
Richdale, L. E. 1945. The nestling of the Sooty Shearwater. Condor 47(2):45-62. https://doi.org/10.2307/1364035
Robinson, J. L., and I. L. Jones. 2014. An experimental study measuring the effects of a tarsus-mounted tracking device on the behaviour of a small pursuit-diving seabird. Behaviour 151(12-13):1799-1826. https://doi.org/10.1163/1568539X-00003217
Schacter, C. R., and I. L. Jones. 2017. Effects of geolocation tracking devices on behavior, reproductive success, and return rate of Aethia Auklets: an evaluation of tag mass guidelines. Wilson Journal of Ornithology 129(3):459-468. https://doi.org/10.1676/16-084.1
Spear, L. B., and D. G. Ainley. 1997. Flight speed of seabirds in relation to wind speed and direction. Ibis 139(2):234-251. https://doi.org/10.1111/j.1474-919X.1997.tb04621.x
Sun, A., S. Whelan, S. A. Hatch, and K. H. Elliott. 2020. Tags below three percent of body mass increase nest abandonment by Rhinoceros Auklets, but handling impacts decline as breeding progresses. Marine Ecology Progress Series 643:173-181. https://doi.org/10.3354/meps13341
Vandenabeele, S. P., E. L. Shepard, A. Grogan, and R. P. Wilson. 2012. When three per cent may not be three per cent; device-equipped seabirds experience variable flight constraints. Marine Biology 159:1-14. https://doi.org/10.1007/s00227-011-1784-6
Vanderwerf, E. A., D. G. Smith, C. Vanderlip, A. Marie, M. Saunter, J. Parrish, and N. Worcester. 2015. Status and demographic rates of the Christmas Shearwater Puffinus Nativitatis on Kure Atoll. Marine Ornithology 43(2):199-205. https://doi.org/10.5038/2074-1235.43.2.1131
Whittow, G. C. 2020. Wedge-tailed Shearwater (Ardenna pacifica), version 1.0 in A. F. Poole and F. B. Gill, editors. Birds of the World. Cornell Lab of Ornithology, Ithaca, New York, USA. https://doi.org/10.2173/bow.wetshe.01
Wilson, R. P., and C. R. McMahon. 2006. Measuring devices on wild animals: what constitutes acceptable practice? Frontiers in Ecology and the Environment 4:147-154. https://doi.org/10.1890/1540-9295(2006)004[0147:MDOWAW]2.0.CO;2
Fig. 1
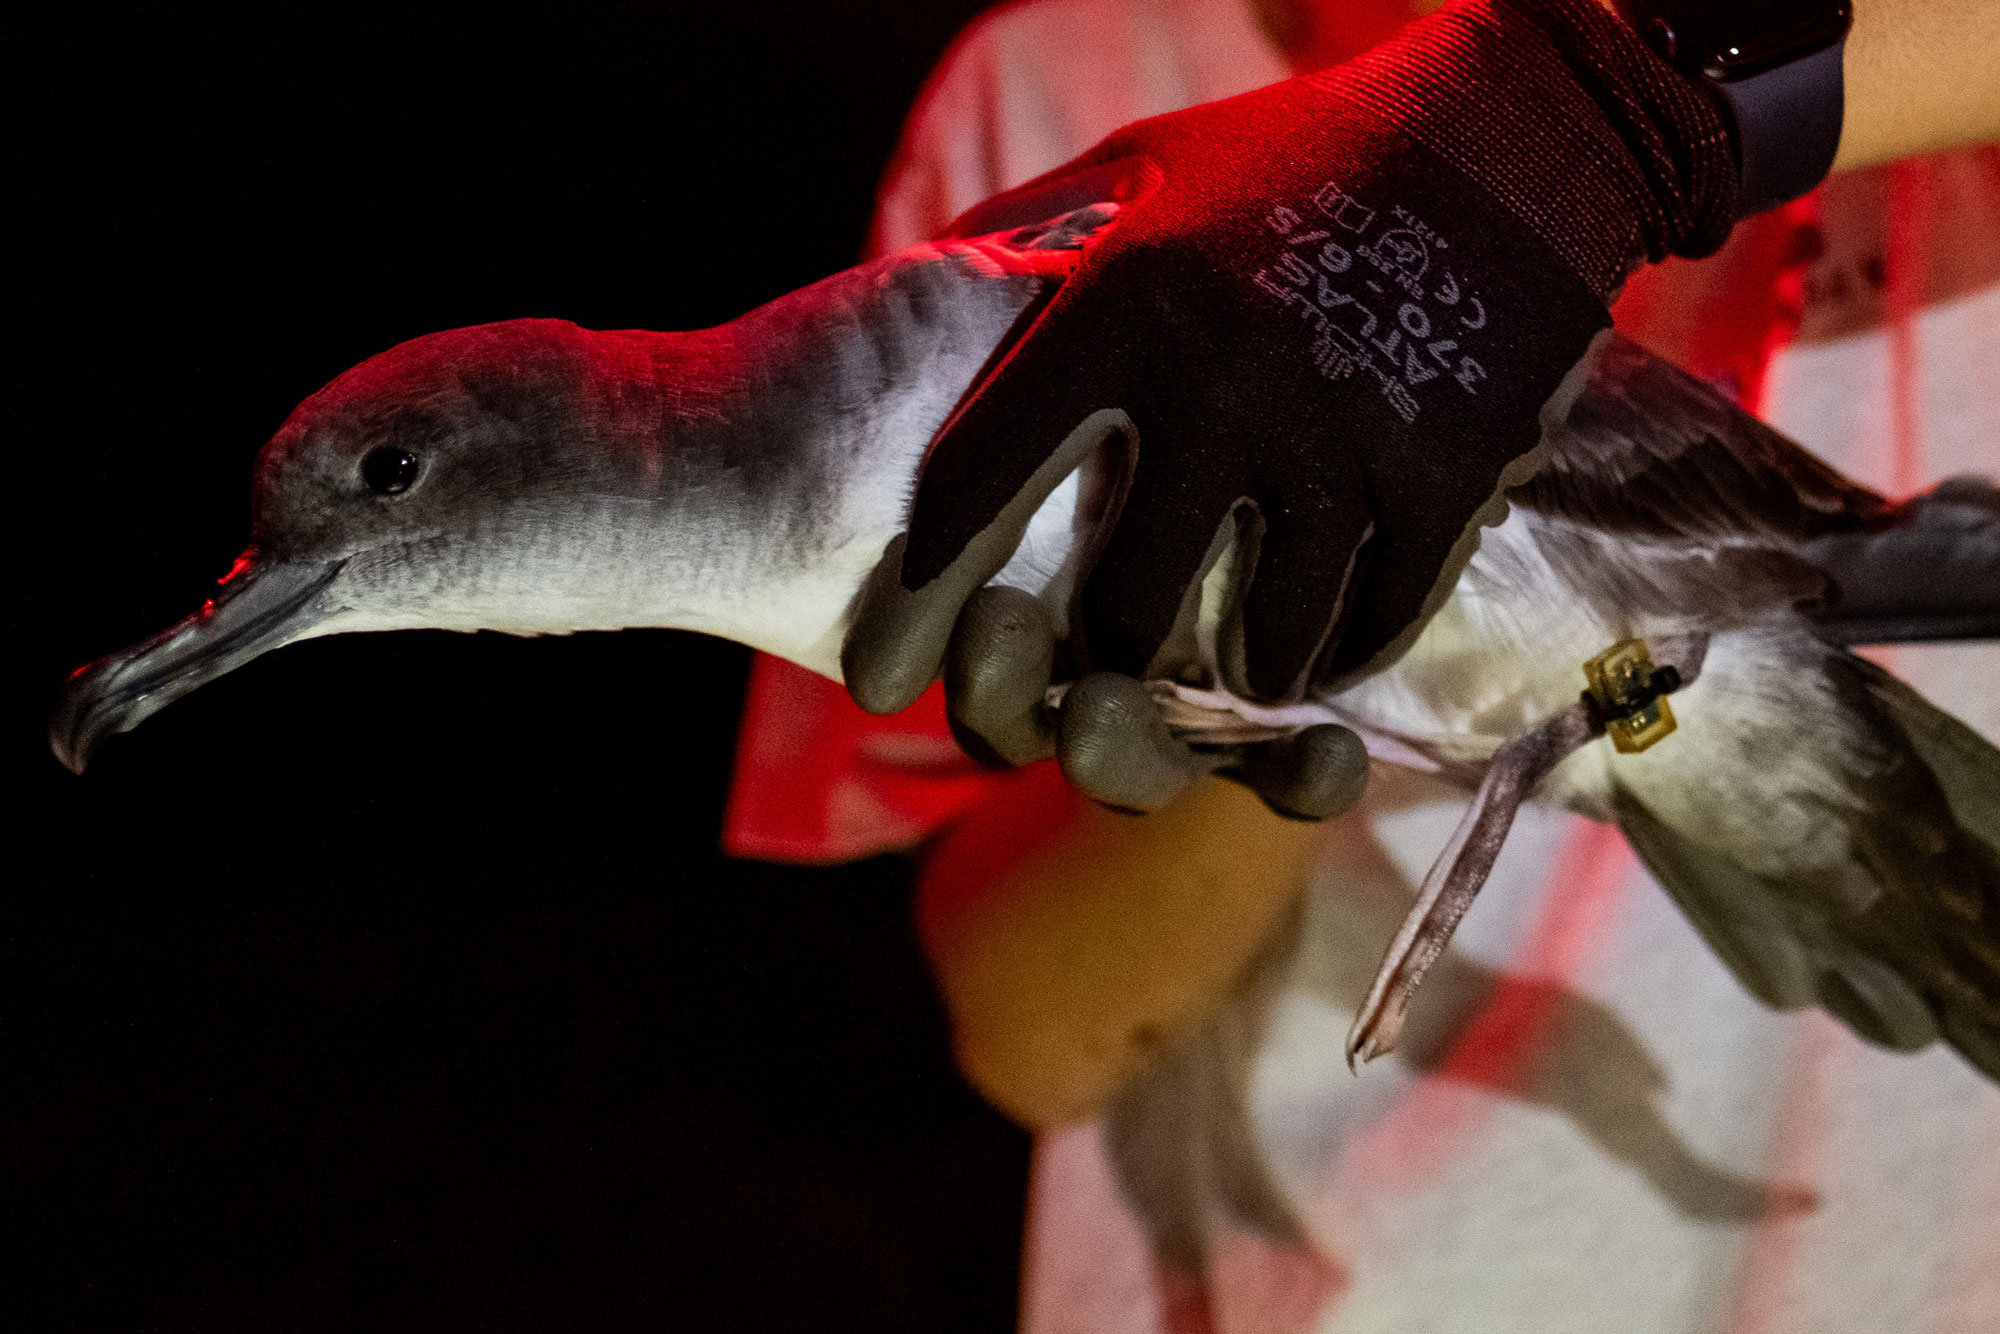
Fig. 1. Light-level geolocators were attached to metal bands on the tarsus of Wedge-tailed Shearwaters (Ardenna pacifica) at the Freeman Seabird Preserve on Oʻahu, Hawaiʻi. Photo by Travis Porterfield.
Fig. 2
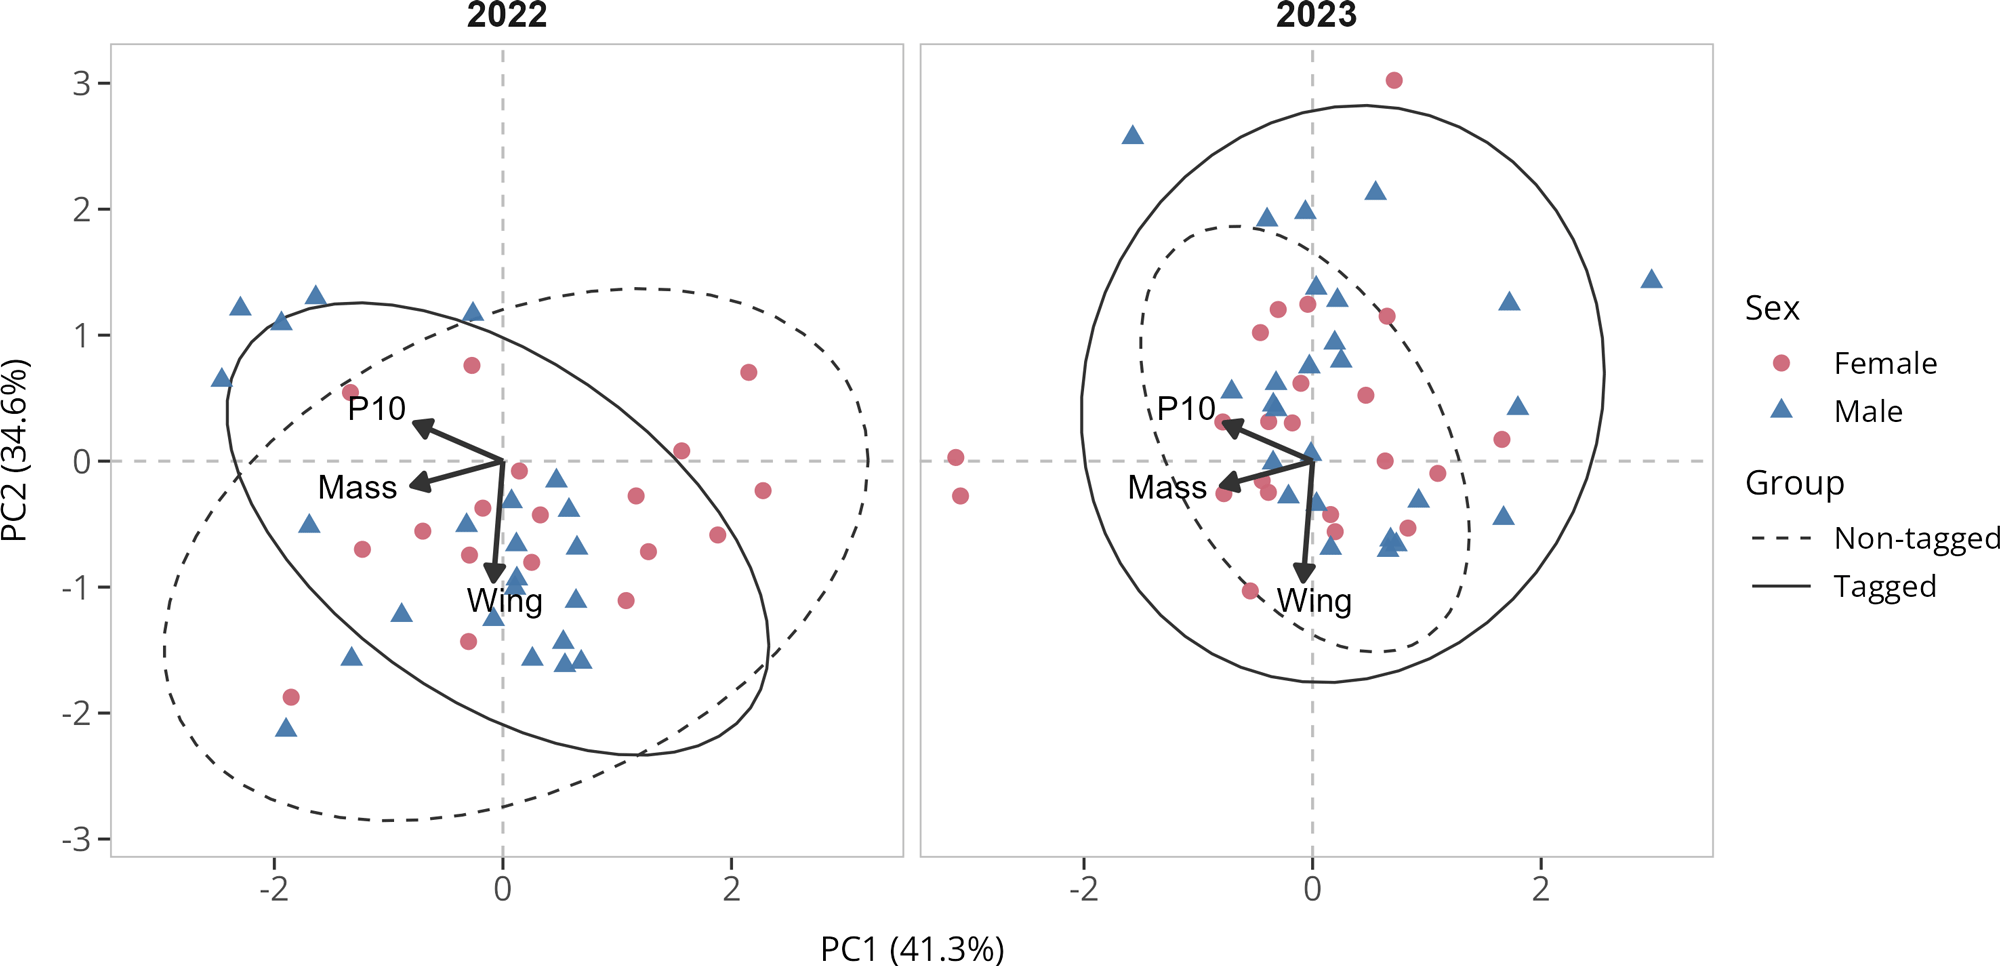
Fig. 2. Principal components analysis (PCA) of Wedge-tailed Shearwater (Ardenna pacifica) chick growth rates, including daily mass gain, wing chord growth, and 10th primary feather (P10) growth. Points represent individual chicks by tagging group (tagged and non-tagged) and breeding years (2022 and 2023). Ellipses represent 95% of the data region for each group based on a multivariate t-distribution. Arrows show the loading vectors for each growth metric on the first two principal components. PCA revealed separation by year and greater overlap among tagging groups within each year, which is consistent with permutational multivariate analysis of variance (PERMANOVA) results showing a significant effect of year, but a non-significant tagging effect.
Fig. 3
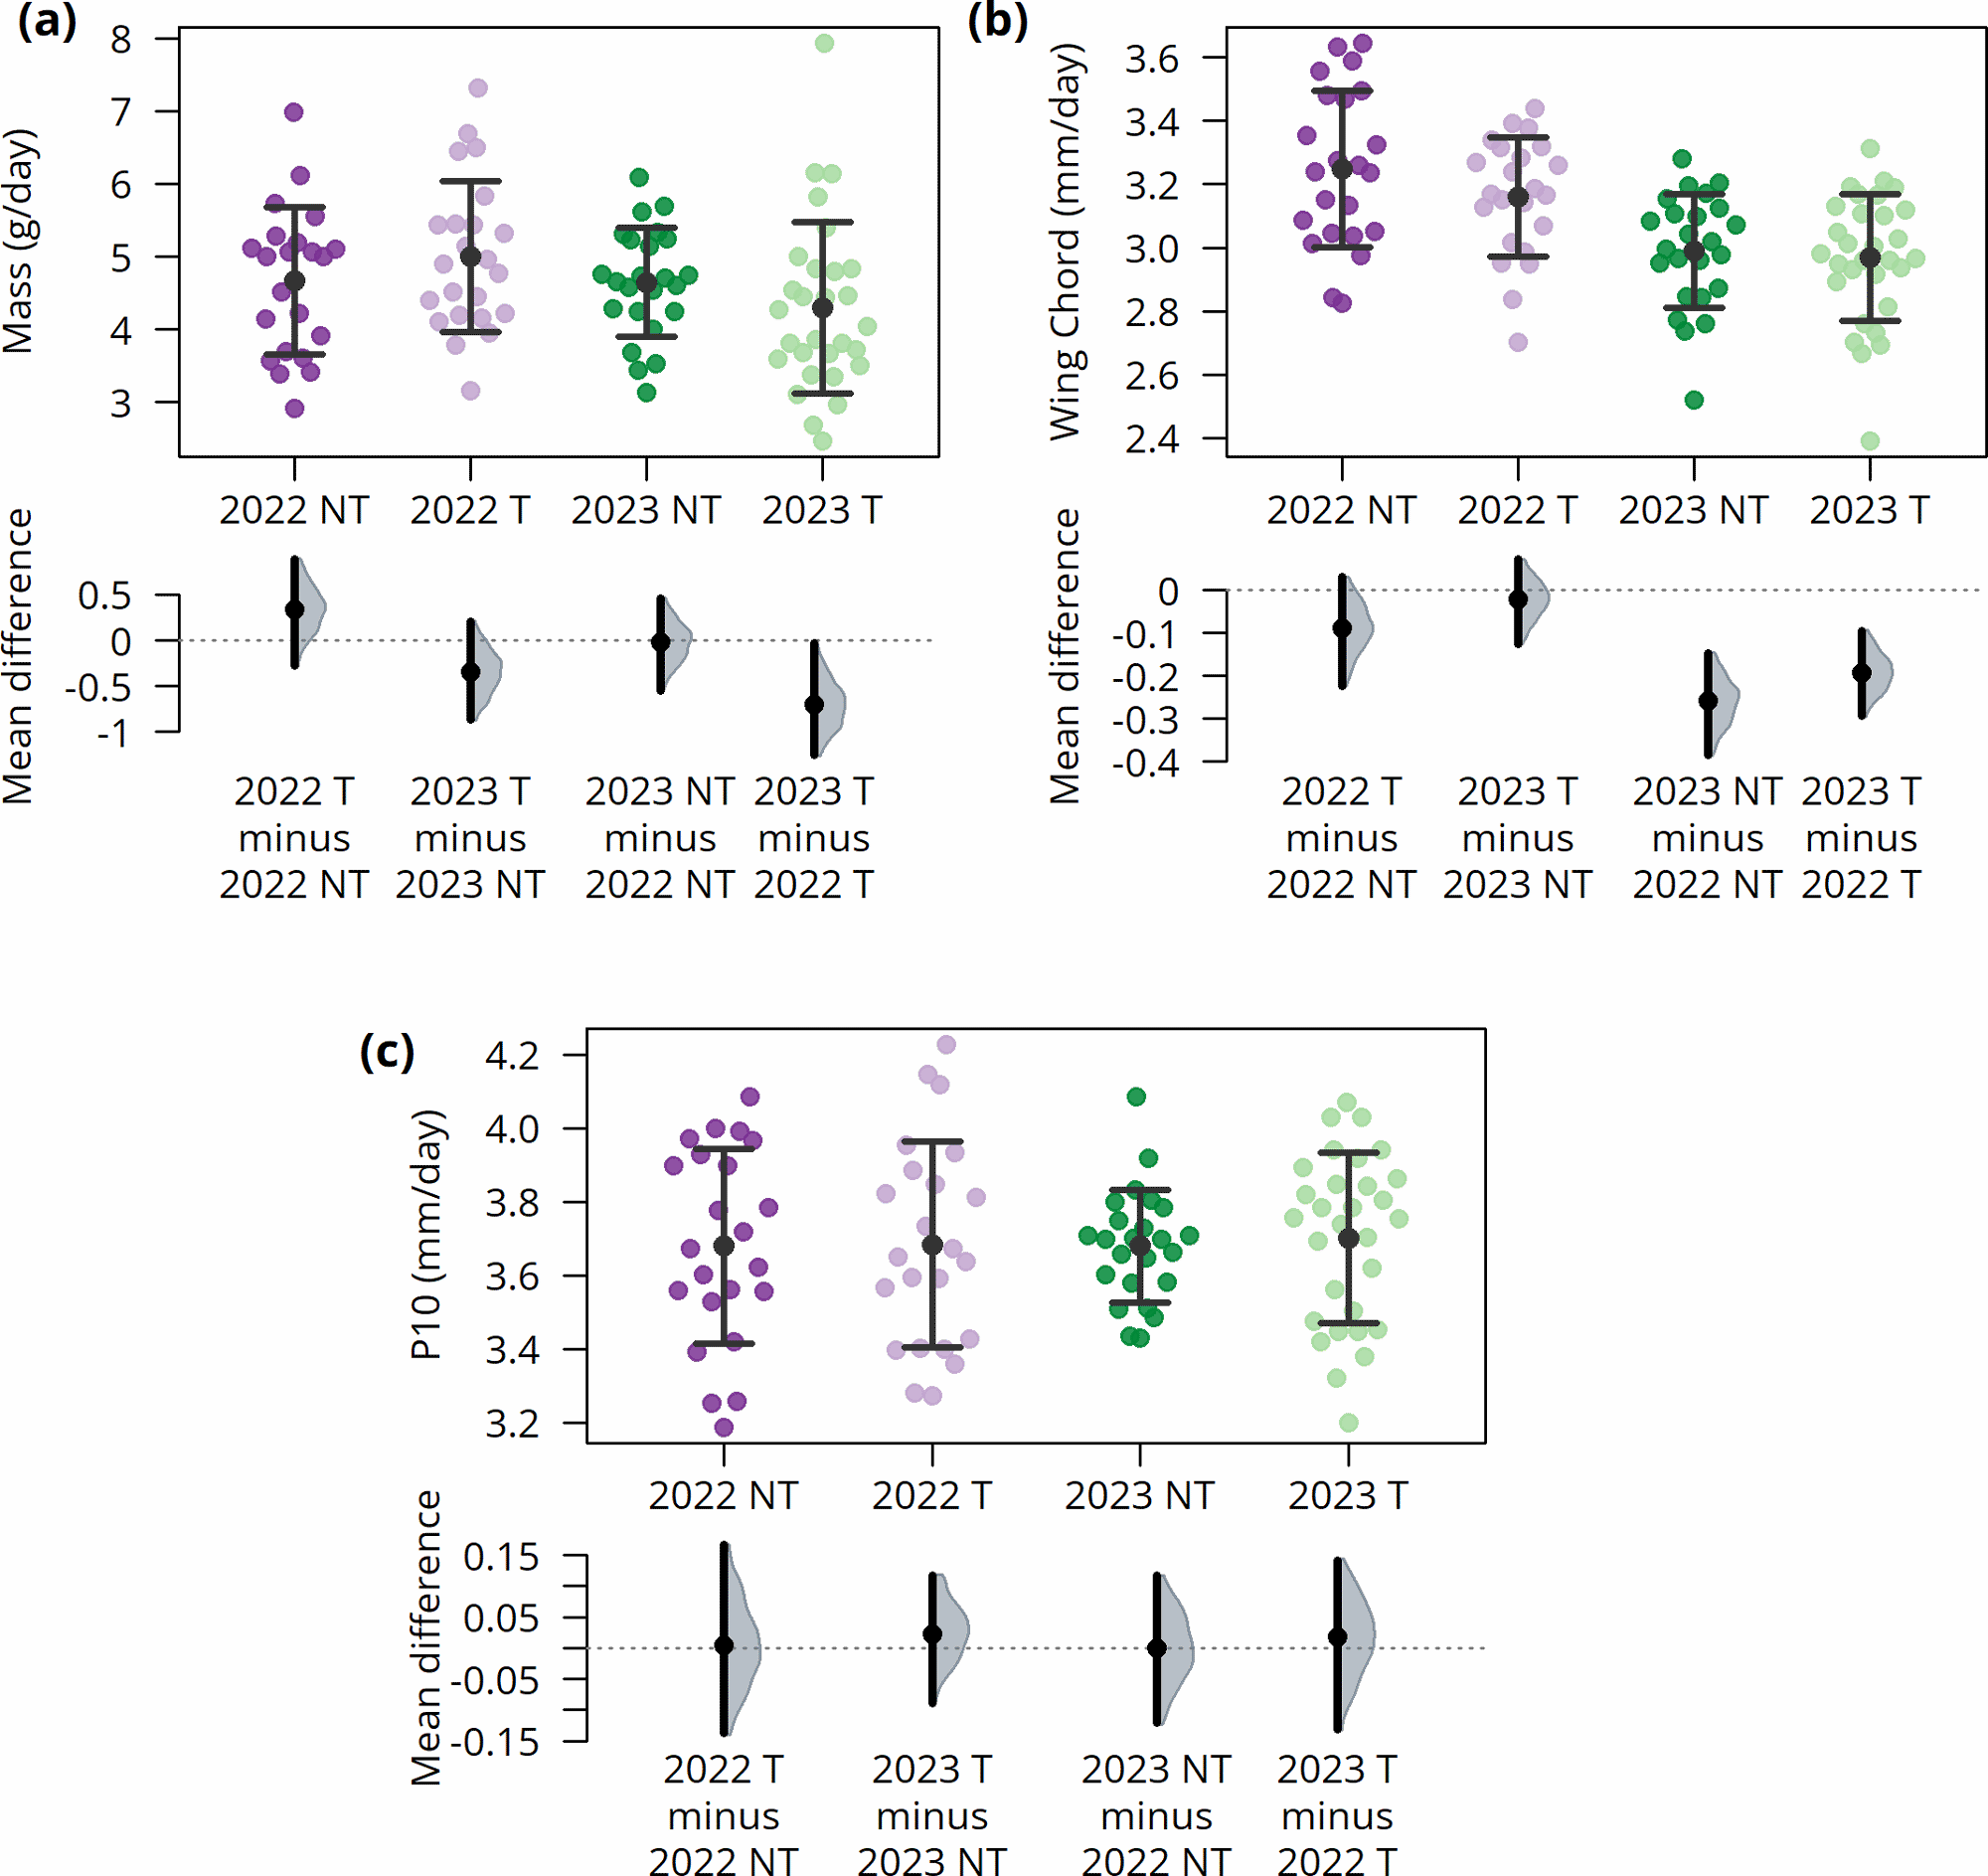
Fig. 3. Chick growth rates of Wedge-tailed Shearwaters (Ardenna pacifica) across tagged (T) and non-tagged (NT) groups and breeding year (2022 and 2023). Growth metrics include (a) daily mass gain, (b) daily wing chord growth, and (c) daily 10th primary feather growth (P10). In the top panels, each colored dot represents a chick’s estimated growth rate, whereas black dots and error bars represent mean ± standard deviation. The effect sizes (bottom panels), quantified as the mean differences, are depicted as black dots; 95% confidence intervals of mean difference as vertical lines; and half violins as sampling distribution (1000 replicates) of bootstrapped differences.
Table 1
Table 1. Sample sizes of Wedge-tailed Shearwaters (Ardenna pacifica) by tagging group (tagged versus non-tagged) and breeding year (2022 and 2023). Adults were recaptured during the subsequent breeding season (2023 and 2024) and blood samples were collected for molecular sexing. Unknown sex indicates individuals for which we could not sample blood.
| Sex | |||||||||
| Year | Group | N | Chicks fledged | Adults returned | F | M | Unknown | ||
| 2022 | Tagged | 25 | 23 | 24 | 9 | 13 | 2 | ||
| Non-tagged | 25 | 23 | 23 | 9 | 11 | 3 | |||
| 2023 | Tagged | 30 | 30 | 28 | 12 | 16 | 0 | ||
| Non-tagged | 24 | 24 | 22 | 10 | 11 | 1 | |||
Table 2
Table 2. Pairwise comparisons of mean differences in chick growth rates between tagged (T) and non-tagged (NT) Wedge-tailed Shearwaters (Ardenna pacifica) between years and treatment groups. Mean differences are presented as bootstrapped 95% confidence intervals using an adjusted bootstrap percentile method. Significant differences are highlighted with bold font.
| Mass | Wing chord | P10 | |||||||
| Comparison | Mean diff | 95% CI | Mean diff | 95% CI | Mean diff | 95% CI | |||
| 2023 T - 2023 NT | -0.45 | -1.07, 0.13 | -0.02 | -0.12, 0.07 | 0.02 | -0.09, 0.12 | |||
| 2022 T - 2022 NT | 0.26 | -0.23, 0.95 | -0.09 | -0.22, 0.03 | 0.004 | -0.13, 0.17 | |||
| 2023 T - 2022 T | -0.63 | -1.20, -0.05 | -0.19 | -0.31, -0.10 | 0.02 | -0.13, 0.15 | |||
| 2023 NT - 2022 NT | -0.09 | -0.46, 0.66 | -0.26 | -0.39, -0.13 | 0.0002 | -0.13, 0.13 | |||
Table 3
Table 3. Summary of general linear models testing the effect of tagging (tagged verus non-tagged) on chick growth rates in Wedge-tailed Shearwaters (Ardenna pacifica), while accounting for median hatch date (MHD) and hatch date interval (HDI) as covariates. Separate models were fit for each growth metric (mass, wing chord, and 10th primary feather [P10]). Although p-values are reported for each predictor, each model yields a single R² and an adjusted R².
| Metric | Year | Predictor | Slope | t-value | p | R² | Adj R² | ||
| Mass | 2022 | Treatment | 0.329 | 1.091 | 0.282 | ||||
| MHD | -0.053 | -1.841 | 0.073 | 0.106 | 0.041 | ||||
| HDI | 0.024 | 0.294 | 0.770 | ||||||
| 2023 | Treatment | -0.300 | -1.068 | 0.291 | |||||
| MHD | 0.053 | 1.235 | 0.223 | 0.066 | 0.009 | ||||
| HDI | -0.600 | -1.289 | 0.203 | ||||||
| Wing chord | 2022 | Treatment | -0.081 | -1.244 | 0.221 | ||||
| MHD | 0.005 | 0.808 | 0.423 | 0.076 | 0.010 | ||||
| HDI | 0.019 | 1.044 | 0.302 | ||||||
| 2023 | Treatment | -0.013 | -0.254 | 0.800 | |||||
| MHD | 0.012 | 1.537 | 0.131 | 0.057 | < 0.001 | ||||
| HDI | -0.047 | -0.538 | 0.593 | ||||||
| P10 | 2022 | Treatment | 0.006 | 0.069 | 0.945 | ||||
| MHD | -0.004 | -0.491 | 0.626 | 0.014 | < 0.001 | ||||
| HDI | 0.012 | 0.558 | 0.580 | ||||||
| 2023 | Treatment | 0.022 | 0.388 | 0.699 | |||||
| MHD | < 0.001 | -0.100 | 0.921 | 0.006 | < 0.001 | ||||
| HDI | -0.022 | -0.228 | 0.820 | ||||||