


The following is the established format for referencing this article:
Fradet, D. T., B. J. Furnas, and A. Engilis Jr. 2026. Implementation of passive acoustic monitoring to assess site-specific avian diversity on private lands. Journal of Field Ornithology 97(2):1.ABSTRACT
California’s Sacramento Valley has lost much of its native riparian and wetland habitats because of anthropogenic land-use change. Efforts to restore habitat have occurred, and bird responses have been primarily studied on public lands, whereas restoration on private lands remains largely understudied. We assessed avian occupancy using passive acoustic monitoring during the breeding season on a private hunting club, comprising a heterogenous mix of rice, managed wetlands, and native riparian forest, in the Central Valley’s Butte Basin, California, USA. In total, we detected 85 bird species. We detected 95% of the known breeding passerines on the property. Using a multi-species occupancy model, we determined occupancy by habitat for 21 of the most common species on the property, which revealed riparian and oak habitat specialists and reflects occupancy patterns documented for other regions in the Central Valley. We found that native riparian strips support greater species richness compared to marsh and rice habitats, with an average of 30 (90% CI: 2–32) passerine species and 13 (90% CI: 11–16) non-passerine species, despite representing 7% of total land cover. These findings can be used to encourage restoration and protection of native riparian habitat as a practice adopted by private landowners interested in maintaining overall avian diversity on their lands. Passive acoustic monitoring proved an effective method to characterize the overall avian community on this 1020 ha property. However, we believe that there is a lower limit of parcel size to allow for enough independent samples and data to be used in occupancy models. Based off our results, using audio recording units at the parcel level yield species diversity results for breeding passerines comparable to traditional avian survey methods and would provide a less invasive, long-term monitoring technique on private properties, particularly for passerines.
RESUMEN
El Valle de Sacramento de California ha perdido gran parte de sus hábitats ribereños y de humedales nativos debido a cambios de uso de la tierra antropogénicos. Han ocurrido esfuerzos para restaurar hábitats, y las respuestas de aves han sido primariamente estudiadas en tierras públicas, sin embargo, la restauración en tierras privadas sigue poco estudiada. Hemos evaluado la ocupación de aves usando monitoreo acústico pasivo durante la época reproductiva en un club de caza privado, que comprende una mezcla heterogénea de arrozales, humedales manejados y bosque ribereño nativo, en la Cuenca del Valle Central de Butte, California, USA. En total, detectamos 85 especies de aves. Detectamos 95% de los paseriformes en reproducción conocidos en la propiedad. Usando un modelo de ocupación multi-especies, hemos determinado la ocupación de hábitat para 21 de las especies más comunes en la propiedad, lo cual reveló aves especialistas de hábitats ribereños y hábitats de robles, y esto refleja patrones de ocupación documentados para otras regiones en el Valle Central. Hemos encontrado que las franjas ribereñas nativas albergan una mayor riqueza de especies en comparación con hábitats de marismas y arrozales, con un promedio de 30 (90% CI: 2-32) especies de paseriformes y 13 (90% CI: 11-16) de especies no-paseriformes, aunque representen 7% del total de cobertura de la tierra. Estos hallazgos pueden utilizarse para fomentar la restauración y protección del hábitat ribereño nativo como práctica adoptada por propietarios privados interesados en mantener la diversidad general de aves en sus tierras. El monitoreo acústico pasivo demostró ser un método efectivo para caracterizar la comunidad de aves general en esta propiedad de 1020 hectáreas. Sin embargo, creemos que existe un límite menor en el tamaño de parcela para permitir muestras independientes y datos suficientes para ser usados en modelos de ocupación. En base a nuestros resultados, el uso de unidades de grabación de audio a nivel de parcela produce resultados de diversidad de paseriformes en reproducción comparables con métodos tradicionales de censo de aves y podría proporcionar una técnica de monitoreo menos invasiva y de largo plazo en propiedades privadas.
INTRODUCTION
California’s Central Valley has undergone large-scale land use and habitat changes over the last 150 years. Only about 5% of the Valley’s historic wetlands and 2% of the riparian forests have not been severely degraded or lost from conversion to agricultural lands, urban development, deforestation, and flood and water control projects (Katibah 1984, Tiner 1984, Frayer et al. 1989, Dahl 1990). Furthermore, within the Central Valley, private ownership encompasses 80% of the remaining riparian habitat and 68% of managed wetlands (Hickey et al. 2005). Restoration and habitat management on both private and protected lands are necessary for achieving conservation goals and species survival to safeguard biodiversity (Norton 2000, Scott et al. 2001, Jenkins et al. 2015, Kamal et al. 2015, Drescher and Brenner 2018).
The Sacramento Valley (northern third of the Great Central Valley ecoregion) is a 2497.57 sq km heterogeneous matrix of natural and agricultural areas across public and private lands. Understanding how species use this landscape remains fundamental to our ability to conserve species diversity and abundance as well as habitats of conservation importance (Rich et al. 2018). In the Sacramento Valley, coordinated efforts have been implemented to target landscape-level wetland, riparian, and grassland habitat restoration projects, emphasizing private land corridors linking protected federal and state refuges (Central Valley Joint Venture 2020).
Much of the habitat restoration in the Sacramento Valley has occurred in partnership with private landowners, yet avian response and diversity on private lands remain understudied (Knight 1999, Norton 2000, DiGaudio et al. 2015). Of the research that does exist on private lands in the Sacramento Valley, it has been shown that habitat restoration increases avian diversity and supports species of special concern (Hickey et al. 2005, DiGaudio et al. 2015, Dybala et al. 2018). An excellent example of the role of a diverse land conservation matrix and landowner cooperation lies in the Butte Basin. The Butte Basin comprises the northwestern section of the Sacramento Valley, covering 2460 sq km from Red Bluff to the Sutter Buttes (Central Valley Joint Venture 2020). The Basin is a matrix of protected areas including state-owned wildlife areas, federally protected refuges, urban areas, and privately-owned agricultural lands (Central Valley Joint Venture 2020). Connecting the agency wildlife areas of the Butte Basin are a series of long-established private duck clubs that act as buffer zones and corridors that support resident and migratory birds.
Private duck clubs in the Butte Basin are managed to support large numbers of wintering waterfowl by providing food and habitat through seasonally managed marshes, rice paddies, and corn fields (Dybala et al. 2020). These managed clubs constitute a significant portion of available marsh habitat in the Sacramento Valley (Gilmer et al. 1982, Duffy and Kahara 2011), making private duck clubs relevant from a conservation and restoration management perspective. One long-established private duck club in the Butte Basin is Bird Haven Ranch (BHR), a 1020 ha property in southeastern Glenn County. Its natural woodland habitat was originally used for rearing livestock from the early 1900s until the 1960s, when most of the land was converted to rice paddies (McComish and Lambert 1918, Duman et al. 2021). In many ways, this property is a microcosm of the Butte Basin itself and is a perfect private land holding to assess avian diversity on this heterogeneous landscape.
Monitoring birds on private lands is always at the permission of the landowner, and they emphasize the least invasive methods and limited access as primary considerations, which autonomous recording units (ARUs) can fulfill through passive acoustic monitoring. Recent studies have found ARUs to be effective for long-term monitoring of birds (Furnas and Callas 2015, Furnas 2020). The use of ARUs in avian research is increasing rapidly (Shonfield and Bayne 2017a, Darras et al. 2019) as the technology becomes more readily available. ARUs have multiple benefits including providing a permanent record of the survey event, quick deployment, increased survey flexibility, and the removal of the observer’s effect on bird behavior (Shonfield and Bayne 2017a). Studies also found this non-invasive method to yield similar diversity results to point counts truncated at 50 m (Furnas and Callas 2015, Darras et al. 2018, 2019).
Pairing ARUs with occupancy modeling show how species use the landscape through illuminating overall richness across habitat covariates and individual species ecology within an avian community (Furnas and Callas 2015, Rich et al. 2018). Although studying overall diversity can be helpful for assessing habitat management needs, managers and landowners cannot rely on diversity metrics alone. They need to understand the mechanism for why species richness may be higher in one habitat over another, and determining this mechanism comes from studying individual species occupancy (Furnas 2020). Most studies that have used ARUs to assess bird occupancy occur at the landscape level, or examine an ecoregion, because of the ease at which ARUs can be deployed to collect large datasets necessary for these models (Furnas and Callas 2015, Klingbeil and Willig 2015, Campos-Cerqueira and Aide 2016, McGrann and Furnas 2016, Shonfield and Bayne 2017b, Rich et al. 2018, 2019, Furnas and McGrann 2018, Wood et al. 2019, Abrahams and Geary 2020, Dixon et al. 2020, Duchac et al. 2020, Furnas 2020, Hannah et al. 2022, Knight et al. 2022). Infrequently, ARUs have been used to examine occupancy at the site-specific (parcel) rather than an ecoregion level because parcel size can be limiting. Examples include Stiffler et al. (2018), who examined the distribution of rallids across marshes approximately 125–579 ha in size along the Pamunkey and Mattaponi Rivers in Virginia, Díaz-Vallejo et al. (2023), who assessed the occupancy of the range restricted Antioquia Brushfinch (Atlapetes blancae) in Colombia, and Peterson (2021), who studied avian occupancy of small wetlands in the Sierra Nevada foothills. Evaluating the effectiveness of ARUs to gather avian species richness and occupancy data on parcels owned by private landowners may provide a method for identifying diversity drivers on private lands and incorporating more private lands into habitat management and restoration programs in the Sacramento Valley.
This study is among the first that tested the effectiveness of using ARUs to measure occupancy of breeding birds with a multi-species occupancy model at the parcel level in California. We also tested the efficiency of ARUs to detect overall avian diversity at BHR during the breeding season. Finally, we aimed to determine how avian diversity is affected by the three habitat types present at BHR and if individual species occupancy trends on the parcel level reflect individual patterns seen in the landscape level. We predicted that native riparian habitat will contribute the highest avian diversity in a heterogenous landscape that includes managed wetlands and cultivated rice habitats. We also predicted that the occupancy patterns of individual bird species would be congruent with patterns seen across other regions of the Central Valley and illuminate how riparian habitat drives avian diversity.
METHODS
Study site
BHR is a 1020 ha private hunting club located on the east side of the Sacramento River, in Glenn County. It straddles County Road 67 and lies west of Butte Creek; central coordinates are 39.420132°N, 121.898130°W (Fig. 1). Restored wetlands on the property consist primarily of managed seasonal marshes, which are divided into pond units with levee and water control structures to help regulate water depth and maintain independent water control. There are summer irrigated, moist soil wetlands (seasonal marsh), permanent wetlands, and irrigated uplands, mostly planted in row crops for deer, turkey and waterfowl. Planted and naturalized willow-cottonwood riparian habitats exist around the perimeter of most of the managed wetlands. There is cultivated rice planted in late April–early May, with the crops reaching maturity in July. The property also has a significant, narrow (55–275 m wide), native riparian corridor comprised primarily of Valley oak (Quercus lobata) and Oregon ash (Fraxinus latifolia) that runs 5.4 km along the full length of the property along its eastern edge. Every year, managers thin riparian underbrush to reset succession and remove invasive plant species.
Data collection
We used 14 DM-720 Olympus Audio Recorders, which have built-in microphones with a frequency range of 20–20,000 Hz. For each unit, recording levels were set to high, recording mode was set to MP3 320 kbps, zoom mic was set to negative three, central mic was set to on, and low-cut filter, VCVA, V-sync, and rec scene were set to off. ARUs were deployed for a minimum sampling effort of five days and then removed from the field so data could be downloaded. During each sampling effort, recorders were programmed to turn on for five minutes before sunrise, at sunrise, and 30 minutes after sunrise daily, yielding three five-minute recordings, or surveys, a day (Furnas and Callas 2015). This duty cycle ensured battery life could be sustained throughout each five-day sampling effort and provided enough surveys to develop species detection probabilities for the multi-species occupancy model. Batteries were recharged between sampling efforts. Ten recorders were deployed for each sampling effort in 2019 and 14 per effort in 2021. The gap in survey years was the result of COVID-19 restrictions in 2020.
We utilized a Geographic Information System (GIS) to grid the property into 300 m x 300 m plots and categorized each plot as rice, seasonal marsh, or native riparian, based on dominant habitat in each plot. Each of these plots provided an independent sampling grid because distance tests of Olympus recording devices in protective containers have revealed an effective radius of approximately 50 m, meaning clear, identifiable vocalizations in a recording will be from birds occupying the target habitat (Furnas and Callas 2015). Through random number generator, we selected, by habitat type, 33 riparian, 31 marsh, and 32 rice plots, totaling 96 survey plots. Data collection occurred during the resident and neotropical migrant species breeding season (May–July) in 2019 and 2021, distributed evenly by month and habitat type (Table 1). Each ARU was placed in its own 300 m x 300 m plot. To deploy the ARUs, we located the plot using a Garmin handheld GPS and placed equipment centrally into the designated habitat type to minimize sampling non-target habitat that may occur in the mosaic landscape of Bird Haven Ranch. We drove a t-stake into the ground and attached a hard-sided Ziploc with drainage holes about 1 m off the ground with zip-ties. An elastic band attached the recorder to a Styrofoam block that kept the recorder elevated and stabilized in the container. We recorded decimal degree latitude and longitude, took cardinal photos of the surrounding habitat (later used for habitat reference during manual vetting of recordings), and left the ARUs in the field site for a minimum of five days.
Manual vetting
Fradet and Engilis listened to and vetted three days of MP3 recordings (three recordings per day), totaling nine, five-minute recordings, or surveys, from each site rather than the total five-day sampling effort. We made this decision to avoid vetting recordings from particularly windy or rainy days, which negatively impact recording quality. All manual vetting was completed using the software Raven Pro (v.1.6.1). In total, we vetted 864, five-minute recordings, which totaled 4320 minutes of listening. We used Bose Quiet Comfort 2 headphones with noise cancellation on high. Cardinal photos taken at each site were available for habitat reference. We identified each species present in the recording, recorded the time it was detected, and determined its audibility (scale of one–five, with one being a high quality, audible vocalization, and five being a poor quality, low audible vocalization) and detection type (song, call, drum, wing). The audibility was determined qualitatively following Furnas and Callas (2015). We used a combination of visually inspecting the quality and signal-to-noise ratio of the vocalization in the spectrogram and listening to the amplitude of the vocalization in the stereo recording to qualitatively determine audibility. Vocalizations with poor signal-to-noise ratio, lack of distinctive identifying features in the spectrogram (i.e. call fragments), and low amplitude were marked as a five. The effective 50 m range of Olympus recorders marks the distance at which accurate species determination is unlikely because background noise and bird sound are nearly equal in signal power (Funas and Callas 2015). The detections recorded as a five were rejected from analysis to limit the inclusion of attenuated vocalizations from non-target habitat and potential misidentifications, because level five audibility vocalizations were quiet, masked by background noise, fragmented, or did not exhibit diagnostic spectrogram qualities. This step was necessary because the multi-species occupancy model only resolves type II errors (the bird is present but not detected), not type I errors (the bird is not present but detected), so any false positives would hamper model results. To determine the three sampling days for manual vetting, we classified the level of background noise (e.g., wind, rain, and vehicle and air traffic) during each recording using an ordinal variable ranging from one, indicating no noise, to five, indicating loud noise. If background noise of level four or five impacted more than 25% of the recording (masking bird songs), the sampling day was rejected, and another sampling day was selected from the five-day effort for manual vetting.
Data analysis
We used hierarchical multi-species occupancy modeling to create the detection history for avian species by combining our survey data wherein differences among species were treated as hyperparameters varying as random effects about mean values for all species in a group (Iknayan et al. 2014, Furnas and McGrann 2018, Furnas 2020). We estimated occupancies (ψ) and detection probabilities (p) by site (j), survey (j), and species (i) and modeled covariates on occupancy and detection probability with logistic regression. Site-level covariates on occupancy included habitat type. Survey-level covariates on detection probability included time of survey (e.g., 30 min before sunrise, sunrise, 30 min after sunrise) and survey date.

|
(1) |

|
(2) |
Similarly to Furnas (2020), we solved the occupancy model with a Markov chain Monte Carlo algorithm (Link et al. 2002) using JAGS (4.3.1; Plummer 2003) in R statistical software (4.2.1; R Core Team 2022) with the jagsUI package (1.5.2; Kellner 2015). We assumed all parameters had uninformative priors. We ran three independent chains each of 10,000 samples with a burn-in period of 5000 and a thinning rate of three. The Gelman-Rubin convergence statistic assessed effective mixing of these chains, where R̂ < 1.1 indicated convergence (Gelman 2004). We set a Type I error rate of 0.1 (and associated 90% credible intervals) for testing null hypotheses about trends and other model parameters, which follows recommendations for long-term monitoring projects (Bart et al. 2004).
We applied model-based inference (Gregoire 1998) to extrapolate predicted species-specific occupancies and species richness for each habitat type across BHR using the detection history from the 300 m x 300 m plots. For individual species, we only reported trends of the 21 most detected species, which we defined as species with naive occupancies > 0.25. We made this decision because, although multi-species occupancy modeling pools data to improve community-level inferences (e.g., species richness), occupancy estimates of rarer species were too sparse to fit single-species models and may be less accurate because of shrinkage toward hyper-parameter means (Link et al. 2002).
We used the California Department of Fish and Wildlife’s California Wildlife Habitat Relationships (CWHR) map of the Great Valley Ecoregion (Buck-Diaz et al. 2012) to estimate the percent cover of each habitat type across BHR. We combined CWHR land cover types into three categories: marsh (fresh emergent wetland and water), rice (agriculture), and riparian woodland cover (valley foothill riparian and annual grassland). Calculation of percent habitat cover was done using ArcMap (v.10.8.1). To calculate a species estimated occupancy across all BHR, we multiplied the percent habitat cover to corresponding estimated occupancy for each habitat type calculated by the model and summed the values.
To compare differences between habitat type for species richness and occupancy for individual species, we evaluated the posterior distribution of the parameters by calculating differences as derived quantities within the model. If the 90% credible interval of the difference did not overlap zero, we rejected the null hypothesis and interpreted results as meaningfully different from one another.
RESULTS
Total species captured by ARUs
In total, we detected 85 species representing 16 orders and 38 families, with 64% of all species being passerines. See Table A1.1 for the full list of species detected, with scientific nomenclature.
Species richness by habitat type
Our model estimated that native oak-ash riparian sites support on average 30 (90% CI:27–32) passerine species and 13 (90% CI:11–16) non-passerine species, marsh sites support 23 (90% CI:21–26) passerine species and 8 (90% CI:7–11) non-passerine species, and rice sites support 10 (90% CI:8–11) passerine species and 6 (90% CI:5–8) non-passerine species (Fig. 2). When comparing species richness between habitats as derived quantities within the model for both passerines and non-passerines (marsh and rice, native riparian and marsh, native riparian and rice) all habitat combinations produced a 90% credible interval of the posterior distribution that differed from zero (meaningful result) except for the rice and marsh comparison for non-passerines (Table A2.1). Native riparian habitat supported a meaningfully higher number of passerine and non-passerine species compared to both the marsh and rice habitat. The marsh habitat supported a meaningfully higher number of songbirds species compared to rice habitat but had no meaningful difference in its non-passerine species richness compared to rice habitat. Rice habitat supported the least number of songbird species overall.
Total occupancy
Data from the CHWR Great Valley Ecoregion map revealed marsh units represented 52% of the property, cultivated rice accounted for 41% of the total area, and native oak-ash riparian corridors made up 7% of BHR. These percentages were used to create weighted occupancies for each habitat type. The combined weighted occupancies for each habitat type revealed the likelihood of detecting species with a naive occupancy of > 0.25 (21 species total) at a random point at BHR (Fig. 3). Of these 21 species, the four with the highest likelihood of detection anywhere on BHR were Tree Swallow (Tachycineta bicolor), Brown-headed Cowbird (Molothrus ater), American Robin (Turdus migratorius), and Brewer’s Blackbird (Euphagus cyanocephalus) with a mean total occupancy of 0.86 (90% CI:0.74–0.95), 0.68 (90% CI:0.58–0.78), 0.66 (90% CI:0.58–0.73), and 0.66 (90% CI:0.49–0.82), respectively. Out of these 21 species, the four with the lowest likelihood of detection anywhere on BHR were Western Wood-Pewee (Contopus sordidulus), Nuttall’s Woodpecker (Dryobates nuttallii), Oak Titmouse (Baeolophus inornatus), and House Wren (Troglodytes aedon), with a mean total occupancy of 0.20 (90% CI:0.13–0.28), 0.19 (90% CI:0.12–0.28), 0.16 (90% CI:0.10–0.24), and 0.11 (90% CI:0.07–0.17) respectively.
Occupancy by habitat
We calculated the estimated occupancies by habitat type for a select number of the most detected bird species (naive occupancy > 0.25) at BHR to assess drivers characterizing avian occupancy on BHR (Fig. 4). We chose to investigate the species with the highest and lowest total estimated occupancies of the 21 most common species determined in Fig. 3. The 90% credible intervals of the posterior distributions comparing the difference between the average estimated occupancy for all habitat combinations (marsh and rice, native riparian and marsh, native riparian and rice) for each species is included as Table A4.1. Any habitat combination that produced a posterior distribution that differed from zero was interpreted to have meaningfully different estimated occupancies. Western Wood-Pewee (Contopus sordidulus), Nuttall’s Woodpecker, Oak Titmouse, and House Wren had meaningfully different estimated occupancies between all habitat types, with a strong preference for native oak-ash riparian habitat. American Robin had no meaningful difference in estimated occupancy for marsh and native riparian habitats but did prefer those habitats over rice. Brown-headed Cowbird had a meaningful difference in estimated occupancy between rice and marsh habitats only. Tree Swallow and Brewer’s Blackbird showed no meaningful difference in estimated occupancy between any of the habitat types at BHR. Brown-headed Cowbird, Tree Swallow, and Brewer’s Blackbird lack of habitat preferences and moderately high occupancies across all habitat types indicates their ability to generalize.
DISCUSSION
ARUs proved effective for estimating overall avian species richness present in the breeding season on the site-specific (parcel) level at BHR when compared to traditional monitoring methods. We compared the diversity of species found through passive acoustic monitoring to the known diversity of breeding bird species established through prior traditional avian monitoring methods (transect and point count surveys), which have occurred yearly since 2017. From traditional surveys, we previously confirmed 77 species breeding at BHR using the Breed Bird Atlas criteria (Laughlin et al. 1990), with 39 species of passerines. In comparison, our acoustic surveys successfully captured 65 of the 77 (84%) breeding bird species. ARUs most successfully captured total breeding songbird diversity, with 37 out of 39 (95%) documented breeding passerines. The two breeding passerines that ARUs did not capture during survey periods were Pacific-slope Flycatcher (Empidonax difficilis) and Barn Swallow (Hirundo rustica). ARUs were less successful capturing non-passerine breeding species, with 30 (79%) species captured during the survey periods. Non-passerines generally vocalize less than passerines, indicating ARUs may not be as effective in monitoring for these taxonomic groups. The ARUs recorded an additional two species that had yet to be observed through the visual surveys and point counts at BHR (Black Rail [Laterallus jamaicensis] and Bell’s Vireo [Vireo bellii]). Based on our results, using ARUs at the parcel level yields species diversity results for breeding passerines comparable to traditional methods and would provide a less invasive, long-term monitoring technique on private properties in the Sacramento Valley.
ARUs also proved successful at characterizing avian diversity and occupancy of common species across habitat types on a parcel level at BHR. The results showed that native oak-ash riparian habitat at BHR supported the highest avian diversity. Native riparian habitat supported the highest species richness for both passerines and non-passerines (Fig. 2). Among the most common species, seven of the 21 species at BHR preferred riparian habitat more than both rice and marsh habitat. For another nine species, riparian habitat was equally preferred to marsh over rice habitat, making riparian habitat one of the highest occupied for most of the common species on the property (see Tables A3.1 and A4.1). Other studies in California have also found that native riparian habitat is important for supporting songbird diversity year-round (Dybala et al. 2015), particularly as restored habitat matures (Hickey et al. 2005, Dybala et al. 2018). Stevens et al. (1997) found that western migratory songbirds preferentially select riparian habitat for cover and food during stopovers, with riparian habitat supporting higher diversity and up to 10 times higher density of birds compared to nearby non-riparian habitat. The valley oak (Quercus lobata) is the likely driver of high diversity at BHR; it has been shown that many migrating birds preferentially select for valley oaks while foraging because of an abundance of food sources from the co-evolution of valley oak and native insects (Greco and Airola 2018). The valley oak also attracts and supports species through opportunities for perches, nesting, and niche-partitioned foraging along various parts of the tree (Verner 1979).
Single-species occupancy results successfully characterized oak-ash habitat specialists at BHR and reflected ecoregion passerine occupancy patterns, highlighting the importance of native riparian habitat to support Sacramento Valley’s avian diversity. There were several species with high occupancy in oak-ash habitat and low occupancy in the marsh and rice habitats, including Nuttall’s Woodpecker, Western Wood-Pewee, Oak Titmouse, and House Wren (Fig. 4). These species all have life history traits that make them established oak and riparian specialists in the Valley. For example, House Wrens (Hickey et al. 2005, Gardali et al. 2006) and Nuttall’s Woodpeckers (Hickey et al. 2005) occupy mature riparian restorations sites along the Sacramento River because of their breeding habitat needs, including features attributed to older oak trees, like cavities. Western Wood-Pewee abundance at Sacramento Valley riparian restoration sites was best correlated to years since restoration plantings and higher percentage of riparian land cover (Gardali and Holmes 2011), indicating their need for established, dominant riparian habitat characterized by oaks. Oak Titmouse is used in Valley studies as an oak woodland focal species for its reliance on acorn masts as a food source (Zack et al. 2005). Despite their high occupancy in oak-ash habitat at BHR, these four species had the lowest estimated property-wide occupancy for common birds, which can be linked to habitat availability. The oak-ash habitat comprises thin strips of forest along natural sloughs, representing only 7% of total land cover of the property compared to 52% for marsh and 41% for rice. Thus, these birds at BHR are actively choosing to reside in this limited habitat, indicating their preference for oak-ash forest. Conversely, the habitat generalists with high occupancy in all three habitat types—Tree Swallow, Brown-headed Cowbird, and Brewer’s Blackbird—had the highest estimated occupancies across the entire property (Figs. 3 and 4). Our results parallel habitat preferences found by Rich et al. (2018), who used ARUs to describe avian occupancy at the landscape level of the Central Valley. In the Central Valley, Rich et al. (2018) found the 10 species with the highest estimated occupancies (≥ 0.38) across the Central Valley included Tree Swallow, Brown-headed Cowbird, and Brewer’s Blackbird, with Brown-headed Cowbird having the second highest estimated occupancy (0.65). The 10 birds with the lowest estimated occupancies (≤ 0.08) included oak-ash riparian specialists such as White-breasted Nuthatch, Oak Titmouse, and Western Wood-Pewee, again reflecting the limited amount of oak-ash forest remaining in the region. Our results were also comparable to traditional point count data collected by Point Blue Conservation Science from private lands in the Sacramento Valley, San Joaquin River Basin, and Tulare Basin. Central Valley riparian habitat specialists, such as Western Wood-Pewee, Nuttall’s Woodpecker, and House Wren, were detected at three or fewer out of 53 locations, with Oak Titmouse not being reported in the survey effort (Hickey et al. 2005). Brown-headed Cowbird was the third most common species in terrestrial habitat (Hickey et al. 2005). Maintenance or even expansion of native riparian habitat at BHR remains an important consideration to maintain high avian diversity on the property. The nearly complete reduction of native riparian habitat in the Sacramento Valley has already led to the extirpation and decline of several bird species (Gardali et al. 2006), and riparian habitat loss has been suggested as one of the main sources of decline for western landbirds (Desante and George 1994). We recommend continued monitoring at BHR to establish a baseline of riparian ecosystem health to provide management recommendations to the landowner. Continued monitoring of the Sacramento River Project found that restoration of riparian habitat was successful in supporting overall wildlife gains and objectives (Golet et al. 2013), especially for landbirds (Gardali et al. 2006, Gardali and Holmes 2011).
The ability to collect large amounts of data without the presence of a person (survey team) may appeal to private landowners who want to limit access to their property and, at the same time, benefit scientists who need to collect large datasets to define the importance of private property in wildlife conservation. However, there are some important considerations when using ARUs at the parcel level to make this method compatible with multi-species occupancy modeling that are not a concern at ecoregion level. Occupancy modeling assumes independence between sites. We recommend determining the effective range of the ARU of choice and at least doubling that number to set the minimum distance between unit placements. The effective range may limit samples and disqualify small parcels that do not have enough area to support the number of surveys needed for a multi-species occupancy model. Depending on the maximum sample size available on a parcel, occupancy inferences on rare species cannot be made, because they may not be detected at enough sites across the parcel. For example, we limited occupancy inferences across habitat types to only common species that had naive occupancies exceeding 0.25. Of the 85 species we detected, 35 species were detected at five or fewer sites, including a species of special concern, the Western Yellow-billed Cuckoo (Coccyzus americanus; Dettling et al. 2015). A larger sample size would be needed to generate enough detections on these species to make single-species model inferences on occupancy. However, a multi-species occupancy model can still make inferences on diversity by pooling species to increase effective sample size for community-level metrics. ARUs have unique advantages compared to traditional methods, including having a single reviewer of the data to decrease bias, allowing for simultaneous data collection across sites to increase standardization, the verification of vocalizations, and the ability to easily scale-up a study (Darras et al. 2019). Despite the initial costs of purchasing ARUs, cost of recorder maintenance, and investment in data storage (Shonfield and Bayne 2017a), ARUs are becoming increasingly cost-effective (Furnas and Callas 2015), making the technology more accessible. However, a cost often overlooked with this method is the need for manual vetting. Large datasets like the California Department of Fish and Wildlife Sierra Monitoring Project (5,400 recordings) took hundreds of hours to manually vet (A. Engilis, personal communication). Although there is a growing ability to process data using automated programs (Darras et al. 2019), including the recently released BirdNET (Kahl et al. 2021), manual validation is still needed to evaluate program performance (Pérez-Granados 2023).
CONCLUSION
Heterogeneous landscapes in the Central Valley support the highest avian diversity in the ecoregion (Rich et al. 2018). Despite land-use change in the Central Valley over the last century, community-level occupancy, or beta diversity, has not changed significantly in comparison with the early twentieth century (MacLean et al. 2018). These findings provide hope for conservation because novel landscapes characterize much of the Sacramento Valley, with its mosaic of agricultural, urban, and natural lands (Rich et al. 2018). However, it is becoming more difficult to find public lands to restore because the Sacramento Valley is highly developed. That leaves private lands, which make up 94% of the Central Valley (Hickey et al. 2005), as an increasingly important route toward conserving wildlife. One of the best ways to do so is to reconcile that the Sacramento Valley cannot be restored fully to historic conditions owing to the entire hydrology of the region being controlled as well as expansive agriculture and increasing urbanization (Moyle 2014). Instead, conservationists should work with private landowners to sustain and perhaps increase biodiversity in this novel landscape while also benefiting the land’s designated use by its owners. Collaborating with private landowners has already led to significant benefits for wildlife in the Central Valley across a variety of habitat types. Private landowners protected over 65,000 acres of managed wetlands from 1990 through 2006 through public programs aimed at funding wetland restoration (Central Valley Joint Venture 2020). Restoring riparian habitat on private lands around Putah Creek and the Cosumnes River Preserve found an increase in avian diversity with year-round benefits to songbirds (Dybala et al. 2015, 2018). Lastly, The Nature Conservancy’s BirdReturns program resulted in the greatest density of shorebirds ever reported in agriculture for the Sacramento Valley (Reynolds et al. 2017, Golet et al. 2018), demonstrating how conservation goals can be achieved even on private agricultural lands. Although management of properties like BHR will continue to focus on supporting waterfowl, researchers can, by monitoring with ARUs on private properties, inform landowners of their land’s avian diversity and highlight the importance of native riparian habitats in sustaining that diversity. Doing so might illuminate areas where conservation work is compatible with operations toward the goal of sustaining habitat quality and ultimately avian diversity.
RESPONSES TO THIS ARTICLE
Responses to this article are invited. If accepted for publication, your response will be hyperlinked to the article. To submit a response, follow this link. To read responses already accepted, follow this link.
ACKNOWLEDGMENTS
Funding for this study was provided by support from private landowners, the Lloyd W. Swift Endowment, the Yolo Audubon Society, the Central Valley Joint Venture, the Museum of Wildlife and Fish Biology experiential learning fund, and the Bonderson Family. Our sincere thanks to the owners of Bird Haven Ranch, P. and S. Bonderson, for allowing us to conduct research on their property. We are grateful to the Bird Haven Ranch staff, especially A. Atkinson, R. Pence, M. McDaniel, and D. Hulse for helping to coordinate logistics and use of equipment. BHR Manager A. Atkinson shared the property’s management regime to aid in mapping and ARU deployment. We would like to thank the CDFW Modoc Landscape Research wildlife biologists for training on ARUs protocol and for sharing methodology. We are appreciative of J. Riggio for his expertise in GIS and Figure 1 contribution and Valerie Eddington for providing comments on the manuscript. We also thank the staff of the Museum of Wildlife and Fish Biology, I. Engilis, K. Zumdahl, and J. Trochet for field training and surveys at Bird Haven. Finally, we would like to recognize the field assistants J. McCafferty, L. Williams, K. Duman, E. Maravillas, M. Mah, K. Torres, and C. Tescher for their help in data collection.
DATA AVAILABILITY
The data and code that support the findings of this study are openly available in GitHub at https://github.com/dtfradet/Danielle_Fradet/tree/main/Fradet_2025_JFO.
LITERATURE CITED
Abrahams, C., and M. Geary. 2020. Combining bioacoustics and occupancy modelling for improved monitoring of rare breeding bird populations. Ecological Indicators 112: 106131. https://doi.org/10.1016/j.ecolind.2020.106131
ArcMap. v.10.8.1. ESRI, Toronto, Ontario, Canada. https://www.esri.com/en-us/arcgis/products/arcgis-desktop/resources
Bart, J., K. P. Burnham, E. H. Dunn, C. M. Francis, and C. J. Ralph. 2004. Goals and strategies for estimating trends in landbird abundance. Journal of Wildlife Management 68:611-626. https://doi.org/10.2193/0022-541X(2004)068[0611:GASFET]2.0.CO;2
Buck-Diaz, J., S. Batiuk, J. M. Evens, and K. Street. 2012. Vegetation alliances and associations of the Great Valley Ecoregion, California. California Native Plant Society, Sacramento, California, USA. https://www.academia.edu/34045747/Vegetation_Alliances_and_Associations_of_the_Great_Valley_Ecoregion_California
Campos-Cerqueira, M., and T. M. Aide. 2016. Improving distribution data of threatened species by combining acoustic monitoring and occupancy modelling. Methods in Ecology and Evolution 7:1340-1348. https://doi.org/10.1111/2041-210X.12599
Central Valley Joint Venture. 2020. Central Valley Joint Venture 2020 implementation plan. US Fish and Wildlife Service, Sacramento, California, USA. https://www.centralvalleyjointventure.org/wp-content/uploads/2024/05/CVJV_2020_Implementation_Plan.pdf
Dahl, T. E. 1990. Wetlands losses in the United States 1780s to 1980s. U.S. Department of the Interior, Fish and Wildlife Service, Washington, D.C., USA.
Darras, K., P. Batáry, B. Furnas, A. Celis-Murillo, S. L. Van Wilgenburg, Y. A. Mulyani, and T. Tscharntke. 2018. Comparing the sampling performance of sound recorders versus point counts in bird surveys: a meta-analysis. Journal of Applied Ecology 55:2575-2586. https://doi.org/10.1111/1365-2664.13229
Darras, K., P. Batáry, B. J. Furnas, I. Grass, Y. A. Mulyani, and T. Tscharntke. 2019. Autonomous sound recording outperforms human observation for sampling birds: a systematic map and user guide. Ecological Applications 29:e01954. https://doi.org/10.1002/eap.1954
Desante, D. F., and T. L. George. 1994. Population trends in the landbirds of western North America. Studies in Avian Biology 15(1):173-190. https://digitalcommons.usf.edu/cgi/viewcontent.cgi?article=1349&context=sab
Dettling, M. D., N. E. Seavy, C. A. Howell, and T. Gardali. 2015. Current status of western Yellow-Billed Cuckoo along the Sacramento and Feather Rivers, California. PLOS ONE 10:e0125198. https://doi.org/10.1371/journal.pone.0125198
Díaz-Vallejo, M., S. Chaparro-Herrera, A. Lopera-Salazar, M. Castaño-Díaz, R. Correa, and J. L. Parra. 2023. Use of acoustic monitoring to estimate occupancy of the Antioquia Brushfinch (Atlapetes blancae), a critically endangered species, in San Pedro de los Milagros, Antioquia. Journal of Field Ornithology 94(2):1-13. https://doi.org/10.5751/JFO-00248-940204
DiGaudio, R. T., K. E. Kreitinger, C. M. Hickey, N. E. Seavy, and T. Gardali. 2015. Private lands habitat programs benefit California’s native birds. California Agriculture 69:210-220. https://doi.org/10.3733/ca.v069n04p210
Dixon, A. P., M. E. Baker, and E. C. Ellis. 2020. Agricultural landscape composition linked with acoustic measures of avian diversity. Land 9:145. https://doi.org/10.3390/land9050145
Drescher, M., and J. C. Brenner. 2018. The practice and promise of private land conservation. Ecology and Society 23(2):3. https://doi.org/10.5751/ES-10020-230203
Duchac, L. S., D. B. Lesmeister, K. M. Dugger, Z. J. Ruff, and R. J. Davis. 2020. Passive acoustic monitoring effectively detects Northern Spotted Owls and Barred Owls over a range of forest conditions. Condor 122(3):1-22. https://doi.org/10.1093/condor/duaa017
Duffy, W. G., and S. N. Kahara. 2011. Wetland ecosystem services in California’s Central Valley and implications for the Wetland Reserve Program. Ecological Applications 21:S18-S30. https://doi.org/10.1890/09-1338.1
Duman, K., E. Dean, L. B. Williams, and A. Engilis. 2021. The flora Of Bird Haven Ranch, Glenn County, California. Madroño 68(1):23-38. https://doi.org/10.3120/0024-9637-68.1.23
Dybala, K., T. Gardali, and R. Melcer. 2020. Getting our heads above water: integrating bird conservation in planning, science, and restoration for a more resilient Sacramento-San Joaquin Delta. San Francisco Estuary and Watershed Science 18(4):1. https://doi.org/10.15447/sfews.2020v18iss4art2
Dybala, K. E., A. Engilis, J. A. Trochet, I. E. Engilis, and M. L. Truan. 2018. Evaluating riparian restoration success: long-term responses of the breeding bird community in California’s Lower Putah Creek Watershed. Ecological Restoration 36:76-85. https://doi.org/10.3368/er.36.1.76
Dybala, K. E., M. L. Truan, and A. Engilis. 2015. Summer vs. winter: examining the temporal distribution of avian biodiversity to inform conservation. Condor 117:560-576. https://doi.org/10.1650/CONDOR-15-41.1
Frayer, W. E., D. D. Peters, H. R. Pywell, and W. R. Pywell. 1989. Wetlands of the California Central Valley: status and trends, 1939 to mid-1980’s. U.S. Fish and Wildlife Service, Portland, Oregon, USA.
Furnas, B. J. 2020. Rapid and varied responses of songbirds to climate change in California coniferous forests. Biological Conservation 241:108347. https://doi.org/10.1016/j.biocon.2019.108347
Furnas, B. J., and R. L. Callas. 2015. Using automated recorders and occupancy models to monitor common forest birds across a large geographic region. Journal of Wildlife Management 79:325-337. https://doi.org/10.1002/jwmg.821
Furnas, B. J., and M. C. McGrann. 2018. Using occupancy modeling to monitor dates of peak vocal activity for passerines in California. Condor 120:188-200. https://doi.org/10.1650/CONDOR-17-165.1
Gardali, T., and A. L. Holmes. 2011. Maximizing benefits from riparian revegetation efforts: local- and landscape-level determinants of avian response. Environmental Management 48:28-37. https://doi.org/10.1007/s00267-011-9623-6
Gardali, T., A. L. Holmes, S. L. Small, N. Nur, G. R. Geupel, and G. H. Golet. 2006. Abundance patterns of landbirds in restored and remnant riparian forests on the Sacramento River, California, U.S.A. Restoration Ecology 14:391-403. https://doi.org/10.1111/j.1526-100X.2006.00147.x
Gelman, A. 2004. Parameterization and Bayesian modeling. Journal of the American Statistical Association 99:537-545. https://doi.org/10.1198/016214504000000458
Gilmer, D. S., M. R. Miller, R. D. Bauer, and J. R. LeDonne. 1982. California’s Central Valley wintering waterfowl: concerns and challenges. U.S. Fish and Wildlife Publications 41, Lincoln, Nebraska, USA. https://digitalcommons.unl.edu/usfwspubs/41?utm_source=digitalcommons.unl.edu%2Fusfwspubs%2F41&utm_medium=PDF&utm_campaign=PDFCoverPages
Golet, G. H., D. Brown, M. Carlson, T. Gardali, A. Henderson, K. Holl, C. Howell, M. Holyoak, J. Hunt, K. Holl, et al. 2013. Successes, failures and suggested future directions for ecosystem restoration of the Middle Sacramento River, California. San Francisco Estuary and Watershed Science 11(3):1-29. https://doi.org/10.15447/sfews.2013v11iss3art11
Golet, G. H., C. Low, S. Avery, K. Andrews, C. J. McColl, R. Laney, and M. D. Reynolds. 2018. Using ricelands to provide temporary shorebird habitat during migration. Ecological Applications 28:409-426. https://doi.org/10.1002/eap.1658
Greco, S. E., and D. A. Airola. 2018. The importance of native valley oaks (Quercus lobata) as stopover habitat for migratory songbirds in urban Sacramento, California, USA. Urban Forestry & Urban Greening 29:303-311. https://doi.org/10.1016/j.ufug.2018.01.005
Gregoire, T. G. 1998. Design-based and model-based inference in survey sampling: appreciating the difference. Canadian Journal of Forest Research 28:1429-1447. https://doi.org/10.1139/x98-166
Hannah, K. C., L. F. V. Leston, E. C. Knight, and R. Weeber. 2022. In the twilight zone: patterns in Common Nighthawk (Chordeiles minor) acoustic signals during the breeding season and recommendations for surveys. Avian Conservation and Ecology 17(2):18. https://doi.org/10.5751/ACE-02241-170218
Hickey, C., K. Fehring, G. W. Page, K. Kreitinger, L. E. Stenzel, and G. Geupel. 2005. Avian monitoring on private lands: measuring bird response to easement, restoration, and incentive programs in the Central Valley. Contribution, PRBO Conservation Science, Petaluma, California, USA.
Iknayan, K.J., M. W. Tingley, B. J. Furnas, and S. R. Beissinger. 2014. Detecting diversity: emerging methods to estimate species diversity. Trends in Ecology & Evolution 29:97-106. https://doi.org/10.1016/j.tree.2013.10.012
Jenkins, C. N., K. S. Van Houtan, S. L. Pimm, and J. O. Sexton. 2015. US protected lands mismatch biodiversity priorities. Proceedings of the National Academy of Sciences 112(16): 5081-5086. https://doi.org/10.1073/pnas.1418034112
Kahl, S., C. M. Wood, M. Eibl, and H. Klinck. 2021. BirdNET: A deep learning solution for avian diversity monitoring. Ecological Informatics 61:101236. https://doi.org/10.1016/j.ecoinf.2021.101236
Kamal, S., M. Grodzińska-Jurczak, and G. Brown. 2015. Conservation on private land: a review of global strategies with a proposed classification system. Journal of Environmental Planning and Management 58: 576-597. https://doi.org/10.1080/09640568.2013.875463
Katibah, E.F. 1984. A brief history of riparian forests in the Central Valley of California. Pages 23-29 in R. E. Warner and K.M. Hendrix, editors. California riparian systems: ecology, conservation, and productive management. University of California Press, Berkeley, California, USA. http://ark.cdlib.org/ark:/13030/ft1c6003wp/
Kellner, K. 2015. jagsUI: a wrapper around rjags to streamline JAGS analyses. https://doi.org/10.32614/CRAN.package.jagsUI
Klingbeil, B. T., and M. R. Willig. 2015. Bird biodiversity assessments in temperate forest: the value of point count versus acoustic monitoring protocols. PeerJ 3:e973. https://doi.org/10.7717/peerj.973
Knight, E. C., K. C. Hannah, and J. DeMoor. 2022. In the still of the night: revisiting Eastern Whip-poor-will surveys with passive acoustic monitoring. Avian Conservation and Ecology 17(1):21. https://doi.org/10.5751/ACE-02080-170121
Knight, R. L. 1999. Private lands: the neglected geography. Conservation Biology 13:223-224. https://doi.org/10.1046/j.1523-1739.1999.013002223.x
Laughlin, S. B., J. R. Carroll, and S. M. Sutcliffe. 1990. Standardized breeding criteria codes: recommendations for North American Breeding Bird Atlas Projects. North American Ornithological Atlas Committee, Birds Canada, Port Rowan, Ontario, Canada. https://naturecounts.ca/norac/atlascodes.htm
Link, W. A., E. Cam, J. D. Nichols, and E. G. Cooch. 2002. Of bugs and birds: Markov Chain Monte Carlo for hierarchical modeling in wildlife research. Journal of Wildlife Management 66:277. https://doi.org/10.2307/3803160
MacLean, S. A., A. F. Rios Dominguez, P. De Valpine, and S. R. Beissinger. 2018. A century of climate and land-use change cause species turnover without loss of beta diversity in California’s Central Valley. Global Change Biology 24:5882-5894. https://doi.org/10.1111/gcb.14458
McComish, C. D., and M. R. T. Lambert. 1918. History of Colusa and Glenn Counties, California: with biographical sketches of the leading men and women of the counties who have been identified with their growth and development from the early days to the present. Historic Record Company, Los Angeles, California, USA.
McGrann, M. C., and B. J. Furnas. 2016. Divergent species richness and vocal behavior in avian migratory guilds along an elevational gradient. Ecosphere 7:e01419. https://doi.org/10.1002/ecs2.1419
Moyle, P.B. 2014. Novel aquatic ecosystems: the new reality for streams in California and other mediterranean climate regions. River Research and Applications 30:1335-1344. https://doi.org/10.1002/rra.2709
Norton, D. A. 2000. Conservation biology and private land: shifting the focus. Conservation Biology 14:1221-1223. https://doi.org/10.1046/j.1523-1739.2000.01451.x
Pérez-Granados, C. 2023. BirdNET: applications, performance, pitfalls and future opportunities. Ibis 165:1068-1075. https://doi.org/10.1111/ibi.13193
Peterson, S. M. 2021. The effects of landscape, movement, and spillover on avian occupancy in the Sierra Nevada Foothills of California. Dissertation, University of California, Berkeley, Berkeley, California, USA.
Plummer, M. 2003. JAGS: a program for analysis of Bayesian graphical models using Gibbs sampling. In K. Hornik, F. Leisch, and A. Zeiles, editors. Proceedings of the 3rd international workshop on distributed statistical computing. Vienna, Austria. https://www.r-project.org/conferences/DSC-2003/Proceedings/Plummer.pdf
R Core Team. 2022. R: a language and environment for statistical computing. R Foundation for Statistical Computing, Vienna, Austria. https://www.R-project.org/ https://doi.org/10.32614/R.manuals
Raven Pro. v.1.6.1. Cornell Lab of Ornithology, Ithaca, New York, USA. https://www.ravensoundsoftware.com/software/raven-pro/
Reynolds, M. D., B. L. Sullivan, E. Hallstein, S. Matsumoto, S. Kelling, M. Merrifield, D. Fink, A. Johnston, W. M. Hochachka, Bruns, N. E., et al. 2017. Dynamic conservation for migratory species. Science Advances 3(8):e1700707. https://doi.org/10.1126/sciadv.1700707
Rich, L. N., S. R. Beissinger, A. Engilis Jr., J. S. Brashares, and B. J. Furnas. 2018. An evaluation of avifaunal diversity in California’s Great Valley. https://www.researchgate.net/profile/Andrew-Jr-2/publication/327780967_An_evaluation_of_avifaunal_diversity_in_California's_Great_Valley/links/5c95850a92851cf0ae9113d5/An-evaluation-of-avifaunal-diversity-in-Californias-Great-Valley.pdf
Rich, L. N., B. J. Furnas, D. S. Newton, and J. S. Brashares. 2019. Acoustic and camera surveys inform models of current and future vertebrate distributions in a changing desert ecosystem. Diversity and Distributions 25:1441-1456. https://doi.org/10.1111/ddi.12952
Scott, J. M., F. W. Davis, R. G. McGhie, R. G. Wright, C. Groves, and J. Estes. 2001. Nature reserves: do they capture the full range of America’s biological diversity? Ecological Applications 11(4):999-1007. https://doi.org/10.1890/1051-0761(2001)011[0999:NRDTCT]2.0.CO;2
Shonfield, J., and E. M. Bayne. 2017a. Autonomous recording units in avian ecological research: current use and future applications. Avian Conservation and Ecology 12(1):14. https://doi.org/10.5751/ACE-00974-120114
Shonfield, J., and E. M. Bayne. 2017b. The effect of industrial noise on owl occupancy in the boreal forest at multiple spatial scales. Avian Conservation and Ecology 12(2):13. https://doi.org/10.5751/ACE-01042-120213
Stevens, L., B. T. Brown, J. M. Simpson, and R. R. Johnson. 1997. The importance of riparian habitat to migrating birds. Pages 155-164 in J. M. Simpson and R. R. Johnson, technical coordinators. Importance, preservation and management of riparian habitat: a symposium. U.S. Forest Service, Rocky Mountain Forest and Range Experiment Station, Fort Collins, Colorado, USA.
Stiffler, L. L., J. T. Anderson, and T. E. Katzner. 2018. Occupancy modeling of autonomously recorded vocalizations to predict distribution of rallids in tidal wetlands. Wetlands 38:605-612. https://doi.org/10.1007/s13157-018-1003-z
Tiner, R. W. 1984. Wetlands of the United States: current status and recent trends. National Wetlands Inventory, Fish and Wildlife Service, U.S. Department of the Interior, Washington DC, USA. https://www.nawm.org/wetlandsonestop/tiner_wetlands_of_us_report.pdf
Verner, J. 1979. Birds of California oak habitats—management implications. Pages 246-264 in T. R. Plumb, technical coordinator. Proceedings of the symposium on the ecology, management, and utilization of California oaks. US Forest Service, Pacific Southwest Forest and Range Experiment Station, Berkeley, California, USA.
Wood, C. M., V. D. Popescu, H. Klinck, J. J. Keane, R. J. Gutiérrez, S. C. Sawyer, and M. Z. Peery. 2019. Detecting small changes in populations at landscape scales: a bioacoustic site-occupancy framework. Ecological Indicators 98:492-507. https://doi.org/10.1016/j.ecolind.2018.11.018
Zack, S., M. K. Chase, G. R. Geupel, and D. Stralberg. 2005. The oak woodland bird conservation plan: a strategy for protecting and managing oak woodland habitats and associated birds in California. Pages 174-178 in C. J. Ralph and T. R. Rich, editors. Bird conservation implementation and integration in the Americas: proceedings of the third international Partners in Flight conference. Forest Service Technical Report PSW-GTR-101, Pacific Southwest Research Station, Albany, California, USA. https://research.fs.usda.gov/treesearch/31676
Fig. 1
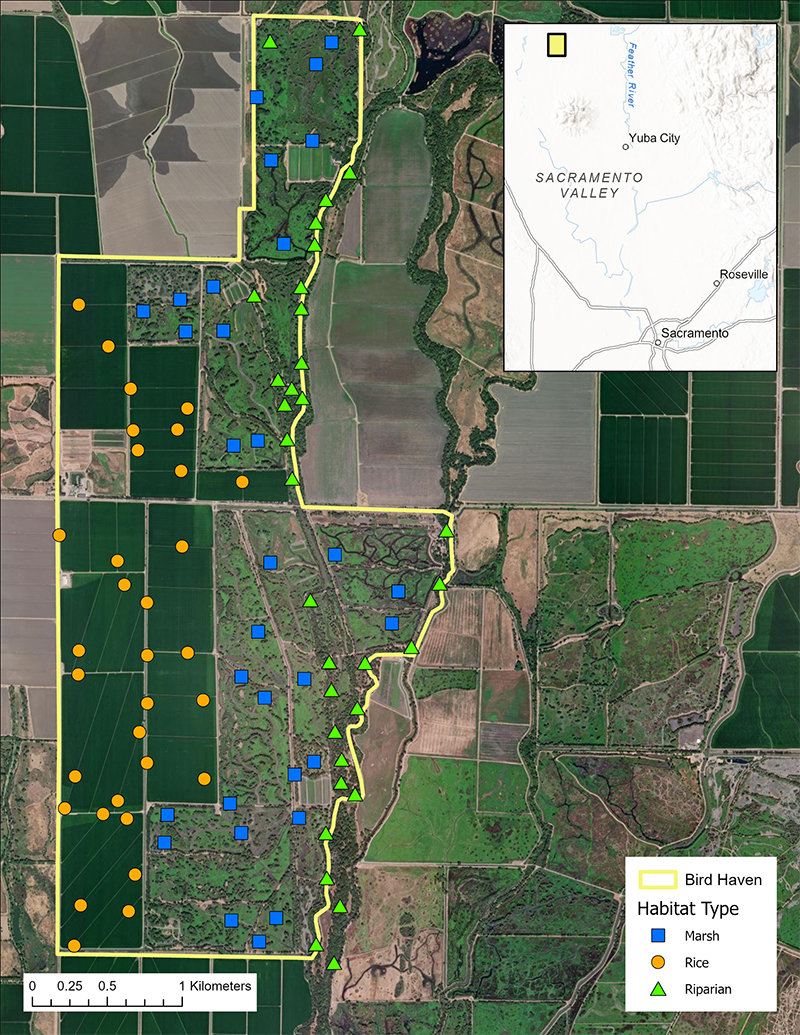
Fig. 1. A map depicting the property boundaries of Bird Haven Ranch (BHR) in Glenn County, California, USA, and the ARU deployment locations by habitat type. In total, 33 riparian, 31 marsh, and 32 rice sites were surveyed using automated recorders between 2019 and 2021. The yellow line denotes the property boundary and blue squares, orange circles, and green triangles denote marsh ARU deployments, rice ARU deployments, and riparian ARU deployments, respectively. The inset map depicts the location of BHR within the Sacramento Valley, with orientation points of Yuba City, Roseville, and Sacramento.
Fig. 2
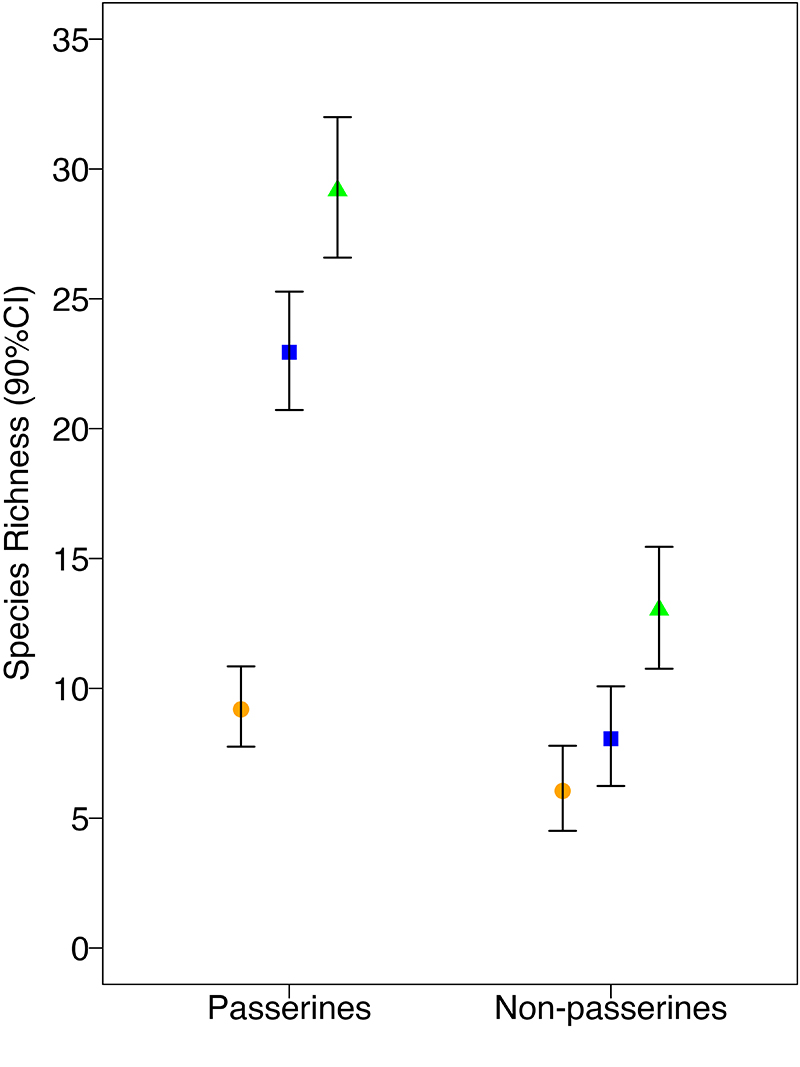
Fig. 2. Estimated passerine and vocalizing non-passerine species richness by habitat (native riparian, marsh, and rice) at Bird Haven Ranch (BHR) in Glenn County, California. In total, 33 native riparian, 31 marsh, and 32 rice sites were surveyed using automated recorders between 2019 and 2021. Species richness is represented along the y-axis and passerine and non-passerine groupings by habitat type are displayed along the x-axis. Species richness estimation points are represented as a green triangle, blue square, and orange circle for native riparian, marsh, and rice habitat, respectively, and 90% credible intervals are denoted by the black bars.
Fig. 3
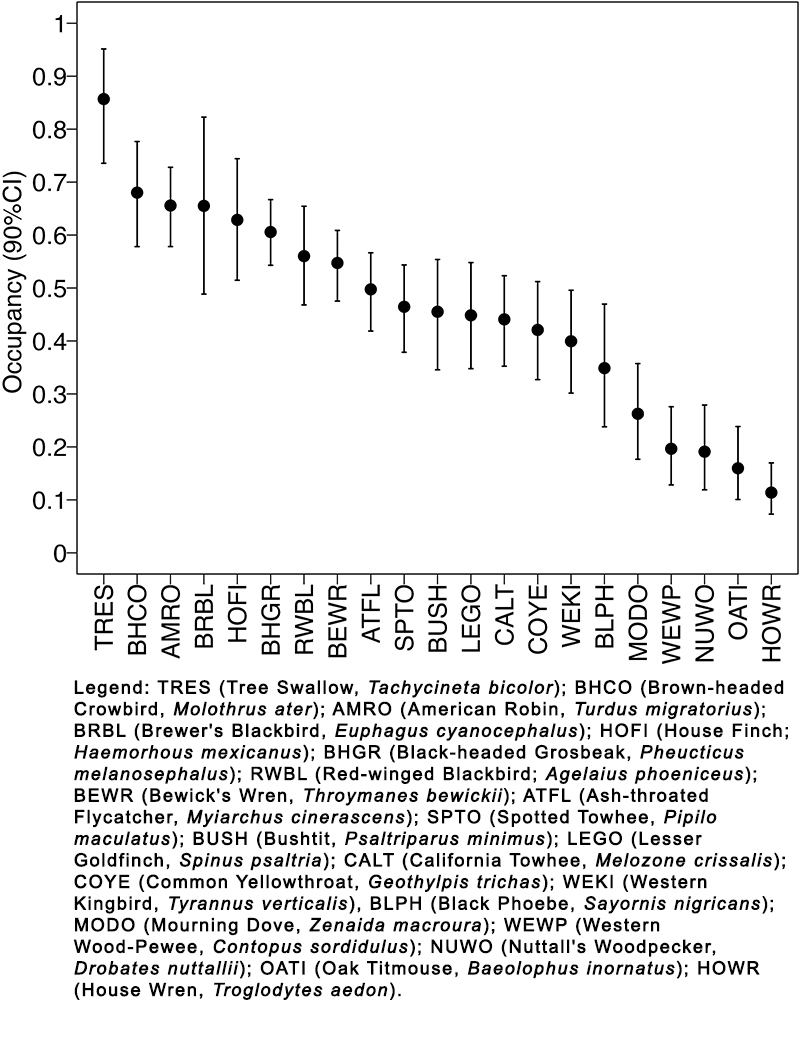
Fig. 3. Estimated total occupancy (all habitats combined) of the most common avian species (naive occupancy > 0.25) at Bird Haven Ranch (BHR) in Glenn County, California. In total, 33 native riparian, 31 marsh, and 32 rice sites were surveyed using automated recorders between 2019 and 2021. Total occupancy was calculated using weighted occupancies determined by percent cover of each habitat on the property. Occupancy is represented along the y-axis and individual species results are displayed along the x-axis. Species from left to right show decreasing order of estimated occupancy. The species are identified with four-letter alpha codes, with full names provided in the legend. Single species estimated occupancy are represented as a black circle and 90% credible intervals are denoted by the black bars.
Fig. 4
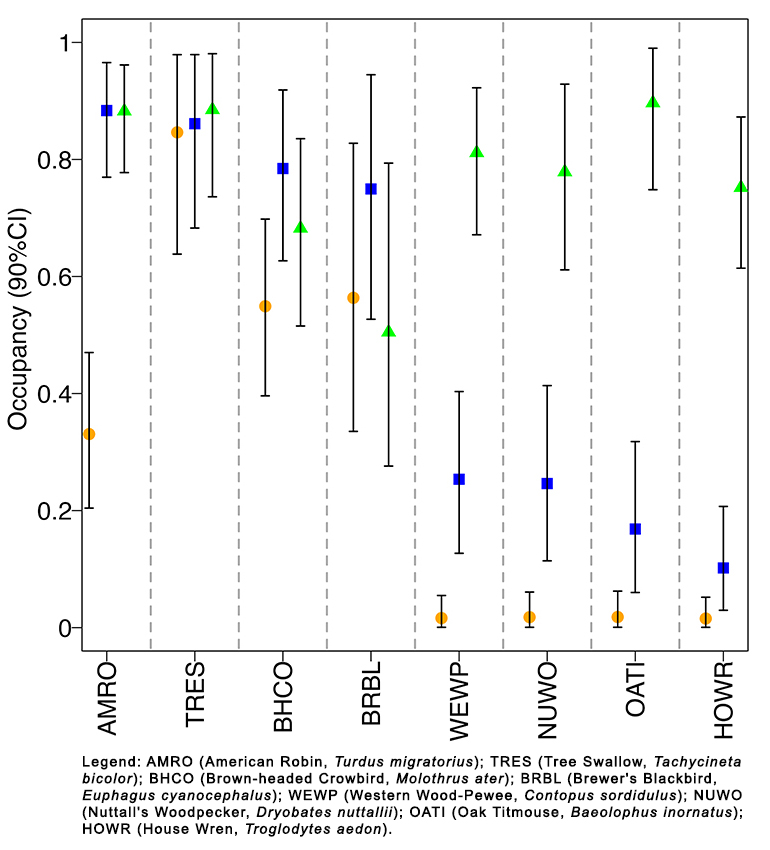
Fig. 4. Occupancy by habitat for selected species of the most detected birds (naive occupancy > 0.25) at Bird Haven Ranch (BHR) in Glenn County, California. A table containing estimated occupancy by habitat for all species with a naive occupancy > 0.25 (21 total) can be found in Appendix 3. In total, 33 native riparian, 31 marsh, and 32 rice sites were surveyed using automated recorders between 2019 and 2021. Occupancy is represented along the y-axis, and individual species results by habitat type are displayed along the x-axis. Dashed gray lines separate single-species occupancy results. Species from left to right show decreasing order of marsh occupancy. The species are identified with their four-letter alpha codes, with full names provided in the legend. Estimated occupancy is represented as a green triangle, blue square, and orange circle for native riparian, marsh, and rice habitat, respectively, and 90% credible intervals are denoted by the black bars.
Table 1
Table 1. Number of sites by habitat and month collected.
| May | June | July | Total | ||||||
| Riparian | 12 | 14 | 7 | 33 | |||||
| Marsh | 12 | 12 | 7 | 31 | |||||
| Rice | 10 | 12 | 10 | 32 | |||||
| Total | 34 | 38 | 24 | 96 | |||||